


- Multifamily rents ended 2025 unchanged from the start of the year, with December rents falling $5 to $1,737 nationally.
- The Midwest and select coastal markets outperformed, while Sun Belt metros posted the weakest rent growth due to excess supply.
- National occupancy rates held steady at 94.6% in November, as retention strategies offset softening demand.
- Single-family build-to-rent rents recorded the sharpest year-over-year drop in over a decade, falling 1.0% in December.
Flat Performance as 2025 Closes
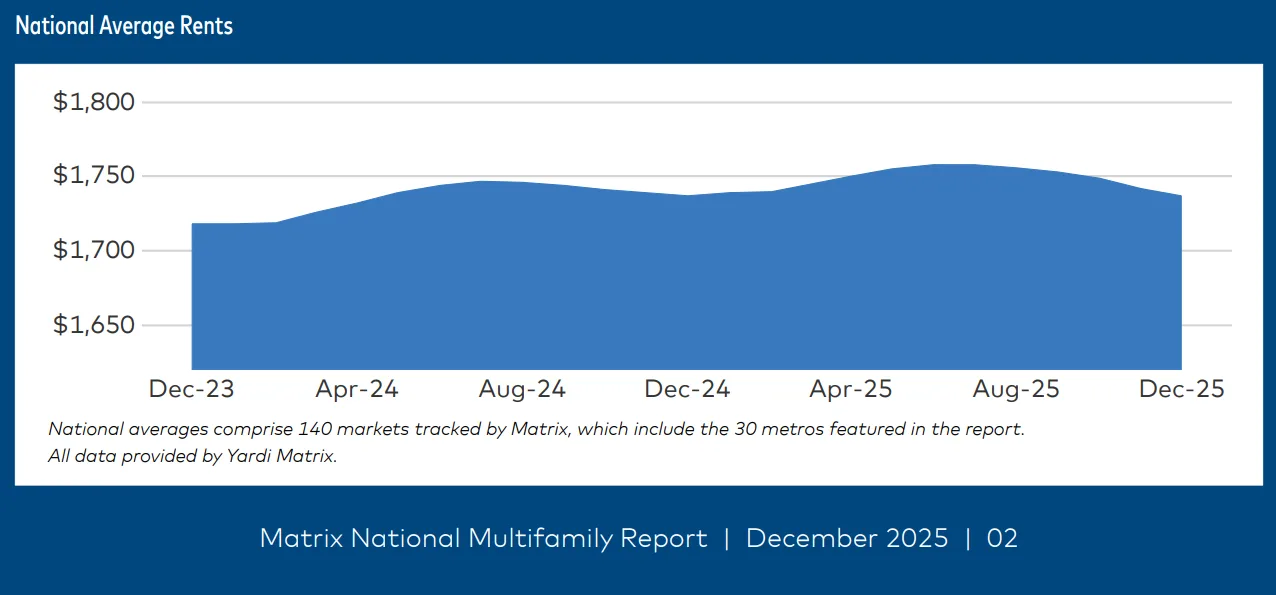
The US multifamily sector ended 2025 with advertised rents back to where they began the year, closing at $1,737 per unit in December according to Yardi Matrix. The fourth quarter saw a notable downturn, with national rents dropping 0.9% quarter-over-quarter—marking the sector’s weakest showing since the global financial crisis. National year-over-year rent growth fell to 0.0%.
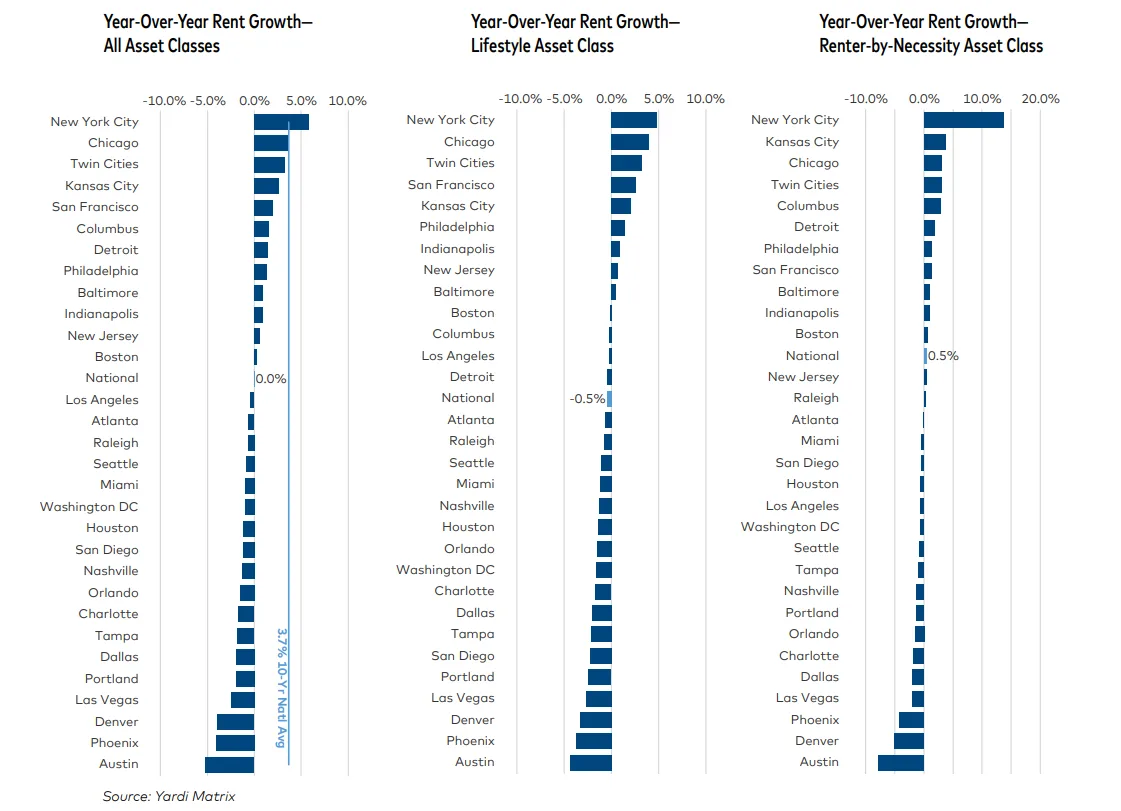
Market disparities persisted, with the Midwest and coastal gateway cities seeing modest growth, while Sun Belt markets led declines. Noteworthy growth occurred in New York (5.8% YoY), Chicago (3.6%), and the Twin Cities (3.2%), while Austin (-5.2%), Phoenix (-4.1%), and Denver (-3.9%) posted the largest declines.
Occupancy Holds Despite Rent Headwinds
Despite soft rent growth, multifamily occupancy rates remained stable at 94.6% nationally in November, virtually unchanged year-over-year. Renter retention strategies and fewer renters transitioning to homeownership helped cushion occupancy. Lifestyle occupancy ticked up 0.2% while Renter-by-Necessity occupancy dipped 0.2%, reflecting divergent renter price sensitivity. Midwestern markets, in particular, helped buoy national occupancy performance, continuing to show relative strength even as other regions softened.
Owners continued to use lower renewal hikes and concessions throughout 2025 as demand moderated and rent growth normalized after 2021–2022’s historic 22% surge.
Regional Shifts and Supply Pressure
Strong Midwest and coastal metros contrasted sharply with Sun Belt markets, which absorbed large new deliveries. Only six of the thirty largest metros recorded positive month-over-month rent growth in December, mostly in the Midwest. Affordability and restrained supply were key supports for these outperforming regions, while the Sun Belt remained soft as new supply outpaced demand.
Multifamily Transaction Activity and Cap Rates
Multifamily sales volume edged up in 2025 to $83.2B, led by Dallas, Seattle, Phoenix, and Miami. Despite high growth in secondary markets, investors continue paying the lowest cap rates for gateway assets—San Francisco’s South Bay (3.8%) and Manhattan (4.1%) among them—highlighting sustained appetite for prime-market multifamily. Cap rates remain tight against mortgage rates, underscoring intense competition and ample capital seeking multifamily exposure.
Get Smarter about what matters in CRE
Stay ahead of trends in commercial real estate with CRE Daily – the free newsletter delivering everything you need to start your day in just 5-minutes
Single-Family Rental Segment Trends
Single-family build-to-rent (BTR) properties saw national advertised rents fall 1.0% year-over-year to $2,180 in December—the lowest growth rate in a decade. Occupancy, though, held firm at 94.9% driven by stalled homebuying activity. BTR operators moderated rent increases to keep occupancy steady, especially in markets with new inventory pressure.
Outlook for Multifamily in 2026
Looking ahead, modest rent growth is expected in 2026 as economic stability returns and GDP growth strengthens. Ongoing supply challenges in some metros and affordability constraints in gateway regions will remain key factors shaping multifamily rent performance over the coming year. Multifamily operators are likely to keep prioritizing retention and competitiveness amid ongoing market normalization.