


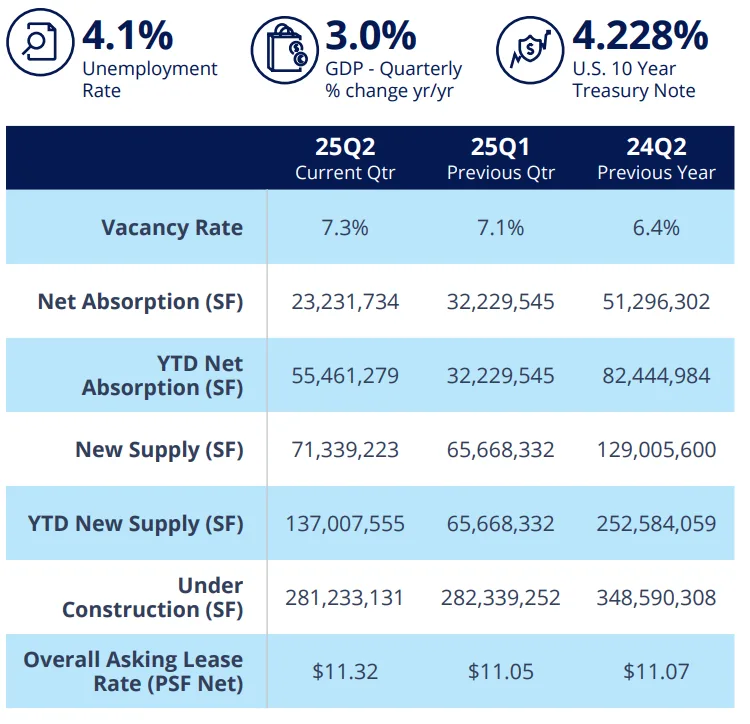
- Vacancy at 12-year high: The national industrial vacancy rate rose to 7.3% in Q2 2025, up 26 basis points from Q1 and 89 basis points year-over-year, edging closer to its cyclical peak.rn
- Positive demand streak continues: Net absorption totaled 23.2M SF in Q2, marking the 60th consecutive quarter of positive demand, though YTD totals are down 33% from 2024.rn
- Supply glut remains: 71.3M SF of new space delivered in Q2 — three times net absorption — keeping upward pressure on vacancies across most regions.rn
- Construction slowdown: Space under construction fell to 281M SF, down 60% from the 2022 peak, with stabilization expected near 250M SF in coming quarters.rnrnrn
Colliers’ report shows that the US industrial market’s long-running growth streak is showing signs of strain. In Q2 2025, the industrial vacancy rate climbed to 7.3%, the highest since 2013, as a wave of construction completions again outpaced demand. While tenant move-ins extended the sector’s remarkable 15-year run of positive net absorption, leasing activity remains well below recent highs, and regional disparities are widening.
Supply Still Outrunning Demand
For the 12th consecutive quarter, new supply exceeded net absorption, contributing to higher industrial vacancy levels nationwide. The 71.3M SF of completions in Q2 was nearly three times the 23.2M SF of space absorbed. Year-to-date, developers have delivered 137M SF — just shy of the 252.6M SF brought online in the first half of 2024.
Construction activity continues to cool, with 281M SF in the pipeline — a steep drop from the record 711M SF in late 2022. Developers are expected to pull back further, with completions projected to slow to ~50M SF per quarter by late 2025.
Regional Snapshot
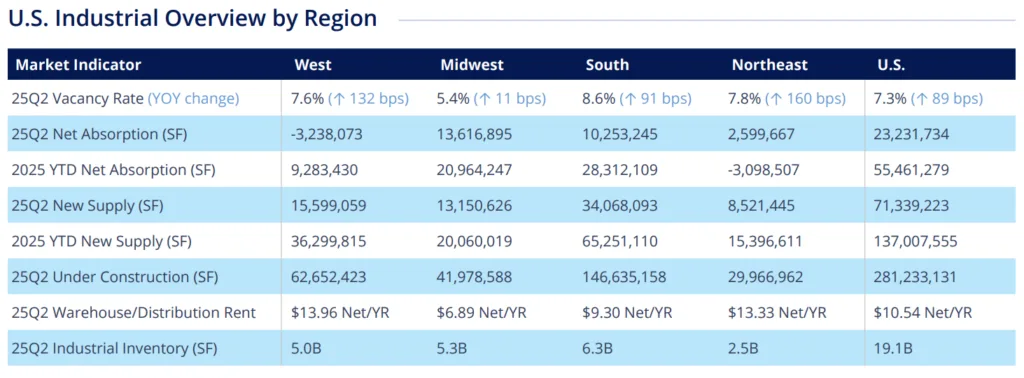
- Midwest: Tightest market at 5.4% vacancy, up only 11 bps YOY. Supply and demand are near balance, with 13.6M SF absorbed in Q2.
- South: Highest vacancy at 8.6%, driven by heavy deliveries in Dallas-Fort Worth, Savannah, and Atlanta.
- Northeast: Vacancy at 7.8%, with mixed performance — NYC metro gained 3.6M SF of occupancy, while Philadelphia posted losses.
- West: Struggling with pockets of negative absorption, especially in Greater Los Angeles, Portland, and San Francisco Bay Area. Vacancy climbed to 7.5%.
Market Leaders
Top Markets for YTD Net Absorption
- Dallas-Fort Worth – 13.3M SF
- Phoenix – 6.8M SF
- Kansas City – 6.7M SF
Largest Q2 Move-Ins
- 1.4M SF – Fort Worth, TX
- 1.3M SF – Pataskala, OH
- 1.2M SF – Cinnaminson, NJ
Rent Trends
While leasing velocity has slowed, rents continue to edge upward. Average warehouse/distribution rents rose 4% YOY to $10.54/SF NNN. The South led gains with a 5.1% increase, while Western markets such as the Inland Empire and Las Vegas saw declines following outsized growth in 2022–2023.
Why It Matters
The industrial sector is entering a market rebalancing phase. The development boom that began during the pandemic is tapering, but elevated industrial vacancy will likely persist into 2026 until supply and demand align. Once economic and trade policy uncertainties clear, analysts expect pent-up demand to drive the next growth cycle.
What’s Next
Vacancy is expected to peak near 7.6% in the coming quarters, with the construction pipeline stabilizing around 250M SF nationally. Gradual rent growth of 3–7% annually is forecast through 2027, and markets tied to regional and last-mile distribution — particularly in the Midwest and select Sun Belt cities — are anticipated to be best positioned for the rebound.
Get Smarter about what matters in CRE
Stay ahead of trends in commercial real estate with CRE Daily – the free newsletter delivering everything you need to start your day in just 5-minutes