


- The national industrial vacancy rate dipped to 8.5% in May, though still up significantly year-over-year.
- Construction starts hit a 7-year low, with just 86.9M SF initiated through May.
- Tariff uncertainty disrupted port activity and trade, pushing demand toward bonded warehouses and alternative supply chains.
- Phoenix and New Jersey led investment activity, while rent growth remained strongest in Miami and Bridgeport.
Trade Policy Impacting Demand Patterns
Tariff volatility continues to ripple across the industrial sector, reports CommercialCafe. A 135% tariff on Chinese imports enacted in April—then temporarily paused in May—led to a 25% dip in cargo at the Port of Los Angeles, illustrating how policy changes are reshaping inventory strategies and port traffic. With retailers now rushing to front-load holiday imports ahead of potential future tariffs, bonded warehouses have become an increasingly attractive option.
Longer-term shifts are also underway, with many manufacturers exploring production moves to Vietnam, India, Mexico, or even reshoring to the US However, domestic expansion faces hurdles from the newly imposed 50% tariff on imported steel, further complicating development costs.
Get Smarter about what matters in CRE
Stay ahead of trends in commercial real estate with CRE Daily – the free newsletter delivering everything you need to start your day in just 5-minutes
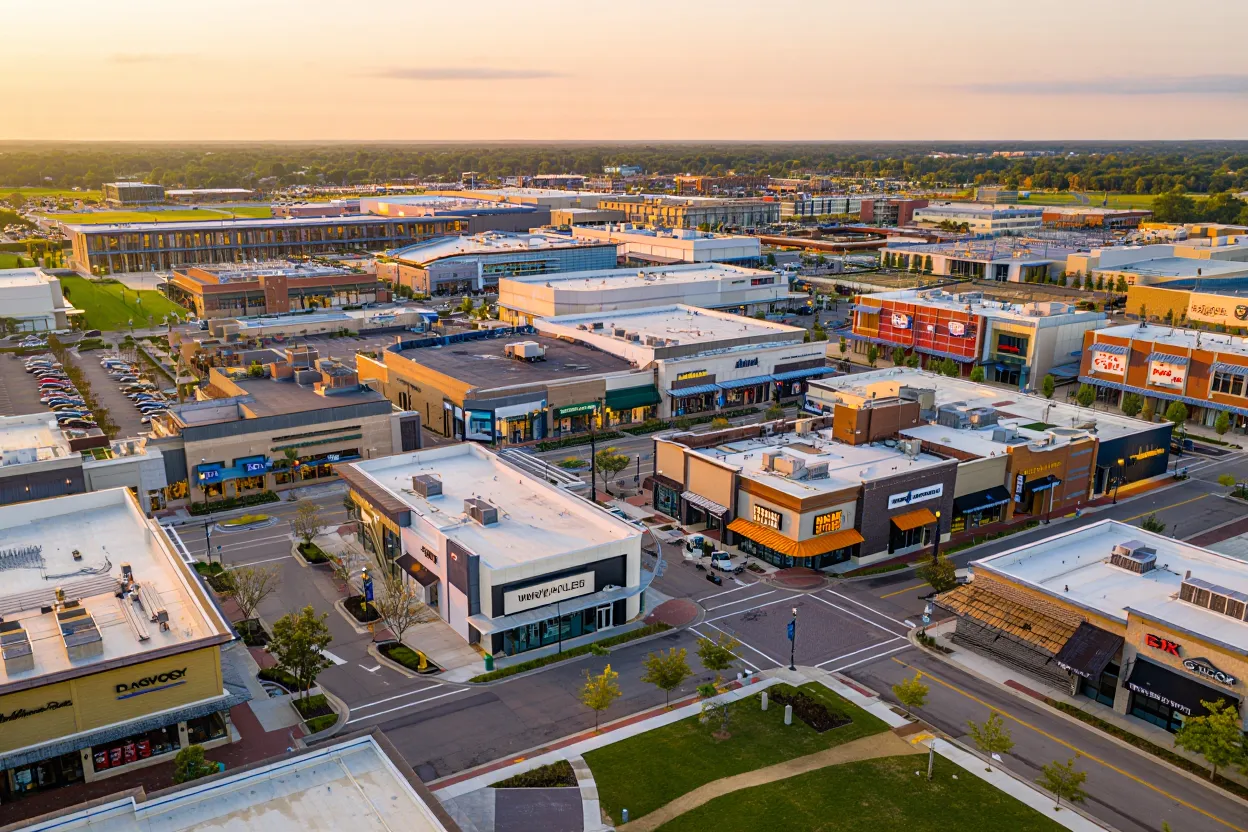
Rents Hold Steady As Lease Spreads Shrink
National in-place industrial rents reached $8.54/SF in May, up 6.3% year-over-year. However, the lease premium for new deals fell to $1.79/SF, down from $2.25/SF in May 2024, as occupiers leverage growing supply and weaker demand to negotiate better terms.
Bridgeport, Miami, and New Jersey posted the largest lease spreads in the country, each exceeding $3.50/SF, suggesting localized demand strength. Meanwhile, Miami’s in-place rent growth of 9.8% YoY leads all US markets.
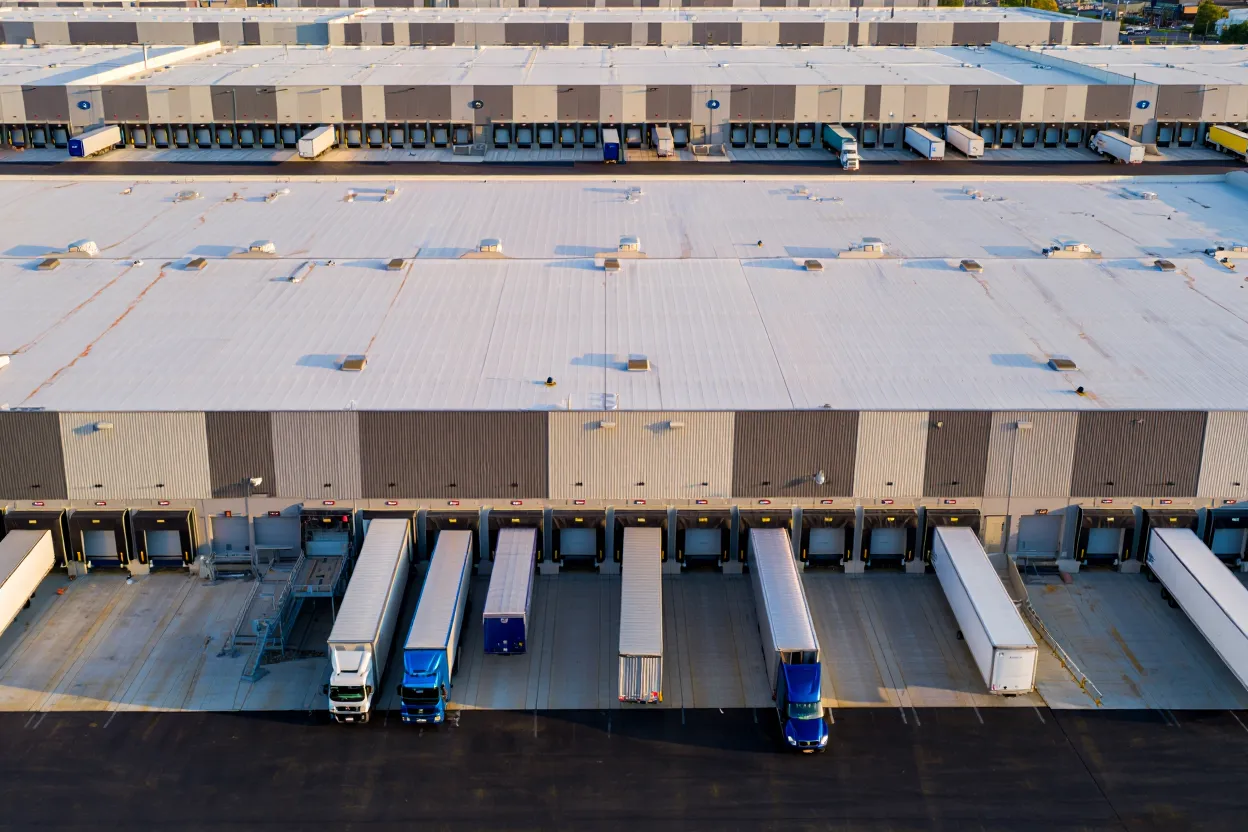
Construction Starts Slow To 7-Year Low
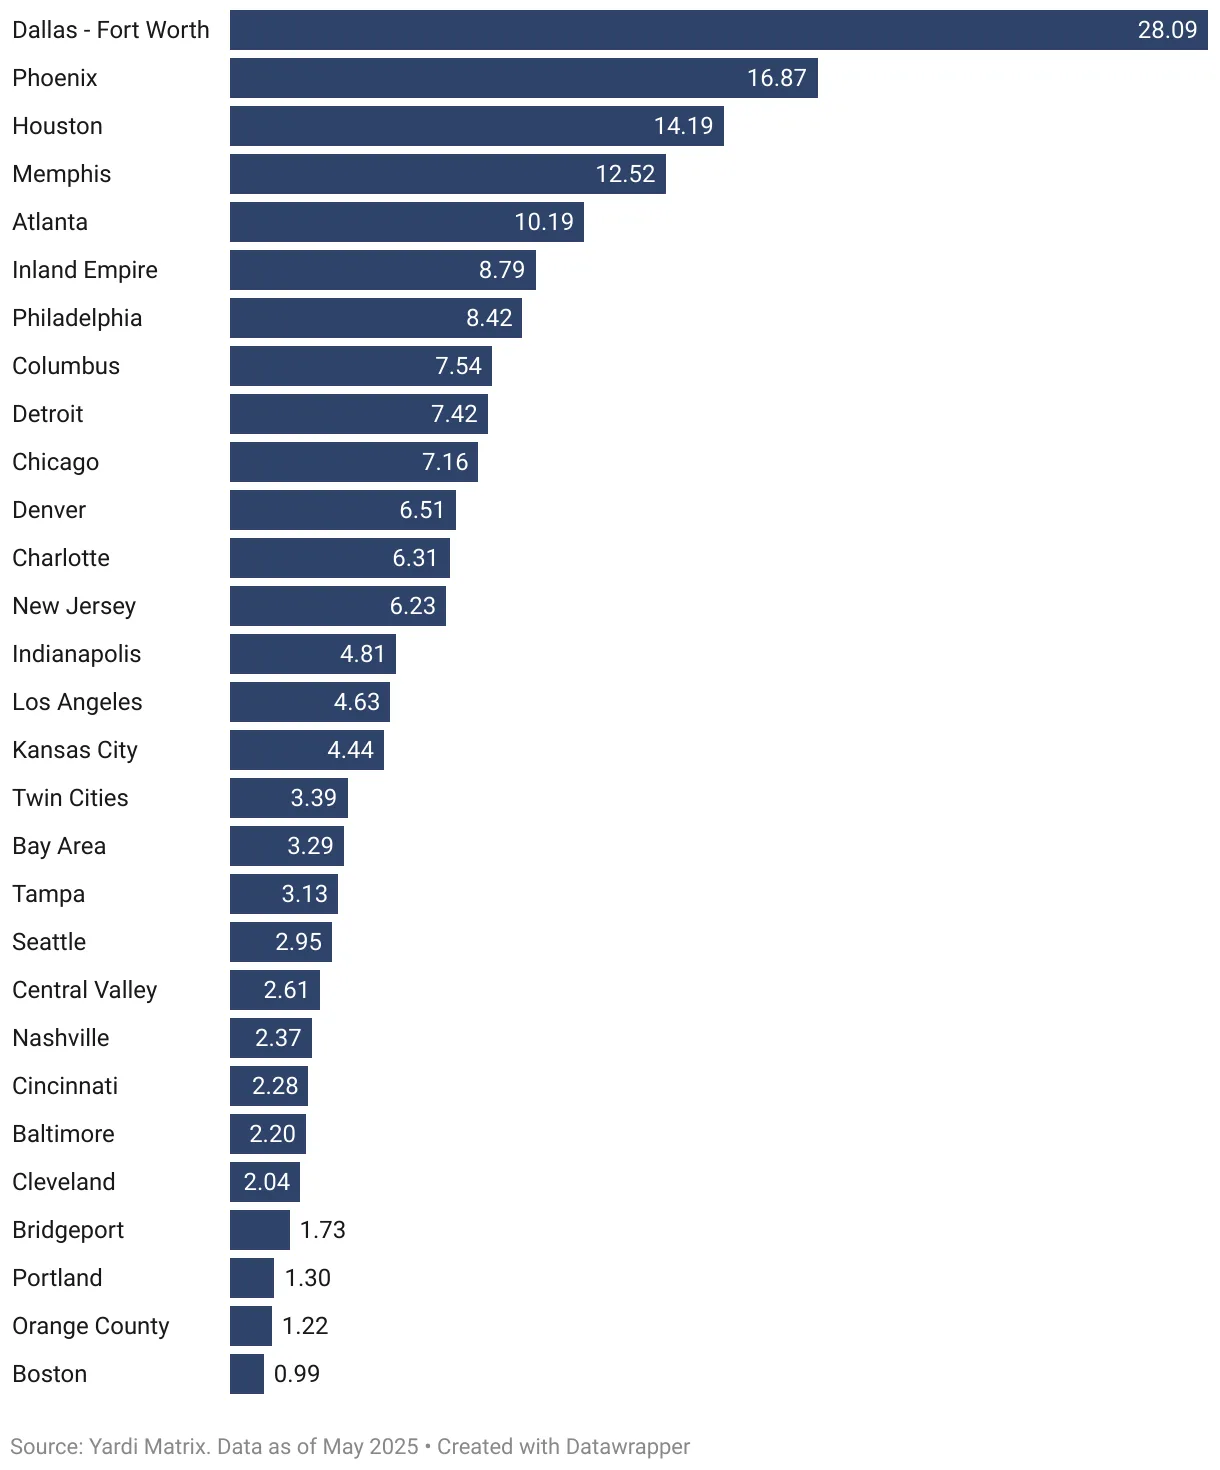
Only 86.9M SF of new industrial construction started through May, positioning 2025 for the slowest annual total since 2018. Although 342.3M SF remains under construction nationally, developer appetite is cooling amid elevated borrowing costs and tariff-related material inflation—especially on imported steel.
Uncertainty over trade policy and slower leasing velocity are delaying absorption of delivered product, particularly in high-supply metros like Indianapolis (10.9% vacancy) and Denver (11.1%).
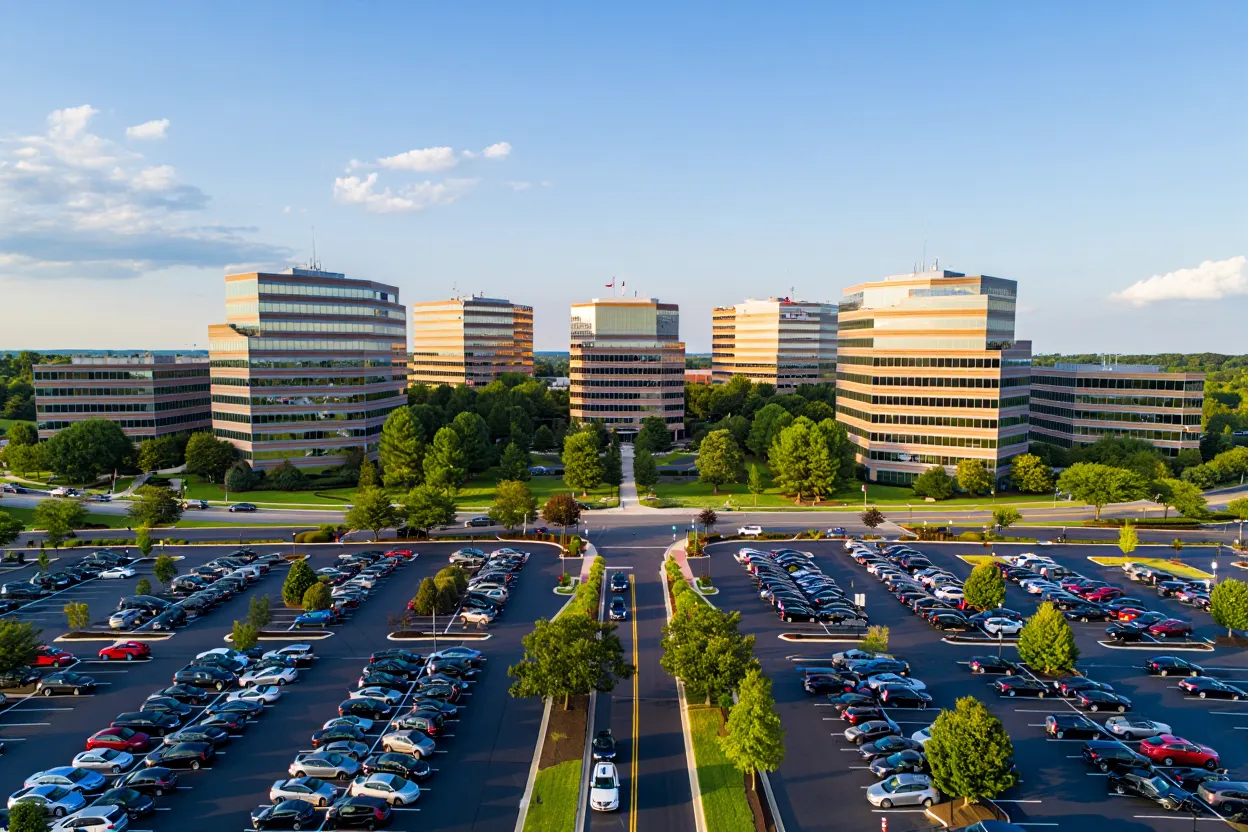
Investment Activity Highlights Market Divergence
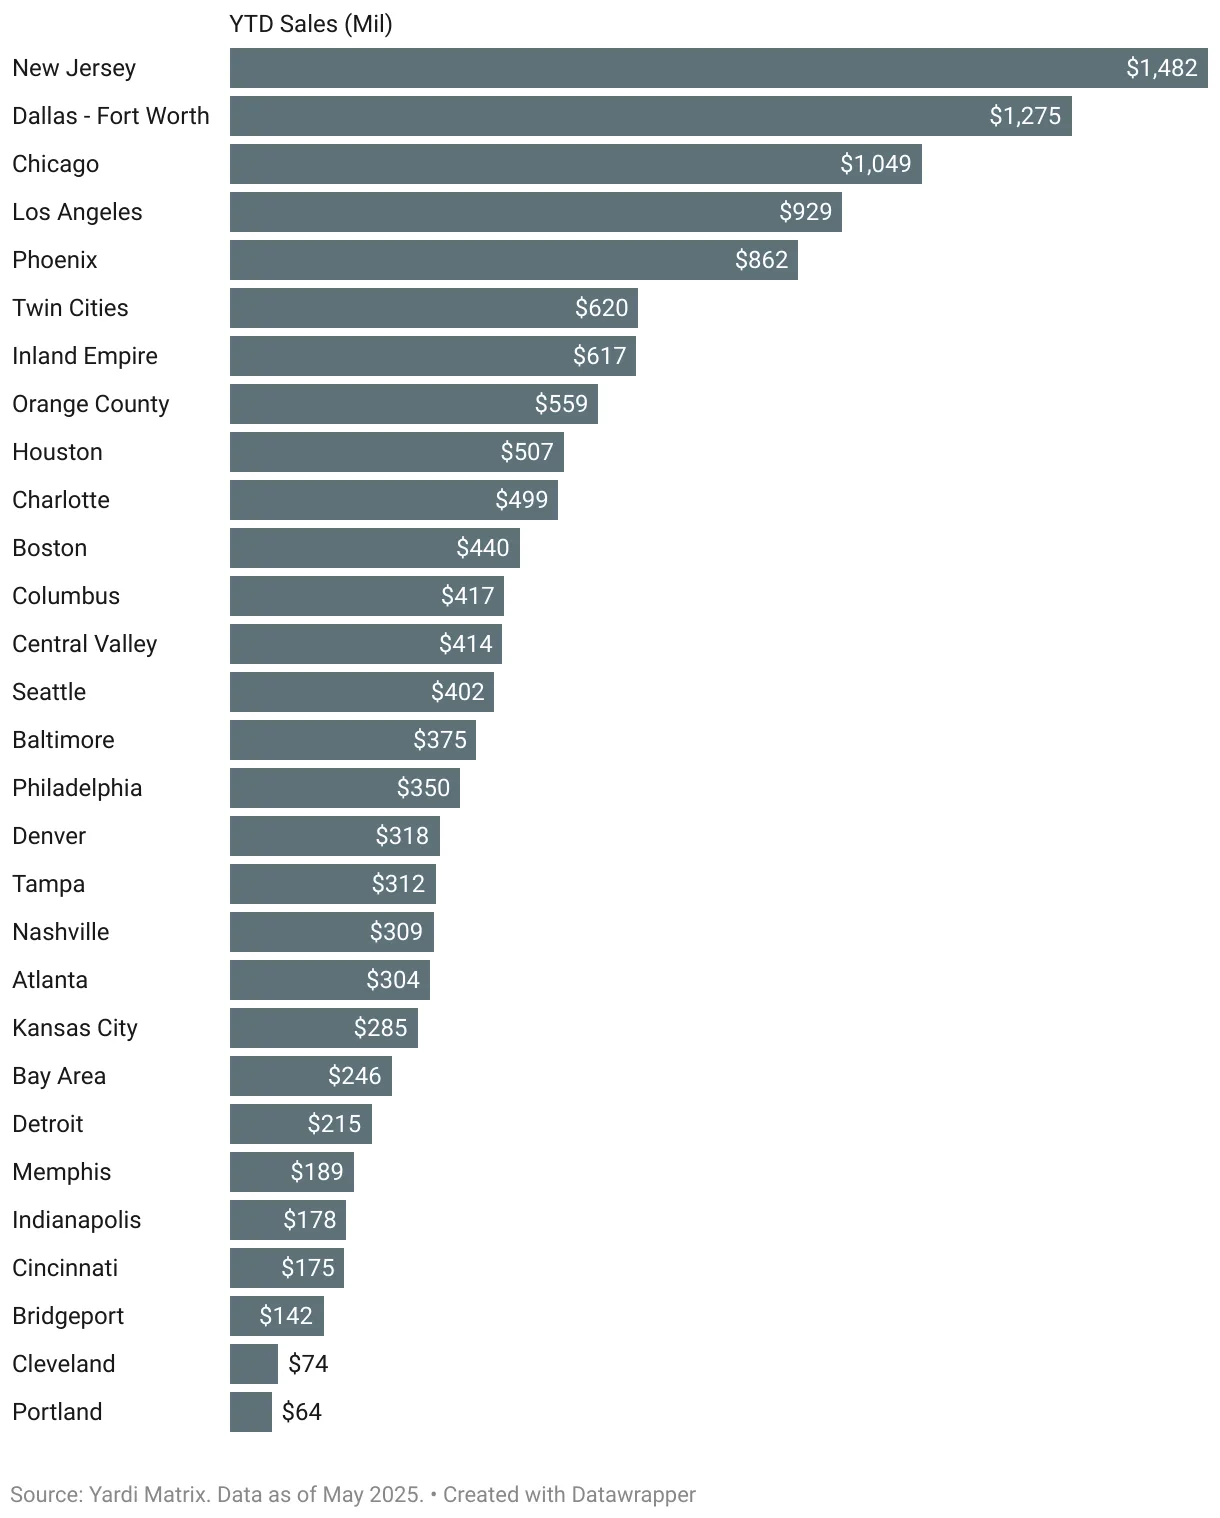
YTD industrial sales totaled $21.4B, averaging $133/SF nationally. Phoenix stood out with $862M in transactions, buoyed by investor interest in logistics and manufacturing space despite a contracting pipeline.
Meanwhile, Los Angeles and Orange County led in pricing, with sales averaging $311/SF and $282/SF respectively. New Jersey, which topped the nation in transaction volume at nearly $1.5B, saw average sale prices of $276/SF, confirming investor preference for coastal gateway markets.
Regional Market Trends
- West: Orange County and Los Angeles remain the most expensive rent markets nationwide. Phoenix leads the region in development (16.9M SF), though significantly down from 2024 levels.
- Midwest: Columbus overtook regional peers in development, with 7.5M SF underway, while Chicago posted the region’s highest sales volume YTD.
- South: Dallas–Fort Worth and Houston dominated construction and sales volume. Miami continued to lead in rent growth, despite having the second-highest vacancy rate (11.7%) nationwide.
- Northeast: New Jersey leads the country in sales volume and ranks among the top in rent growth. Bridgeport boasts the lowest vacancy and the widest lease spread nationwide.
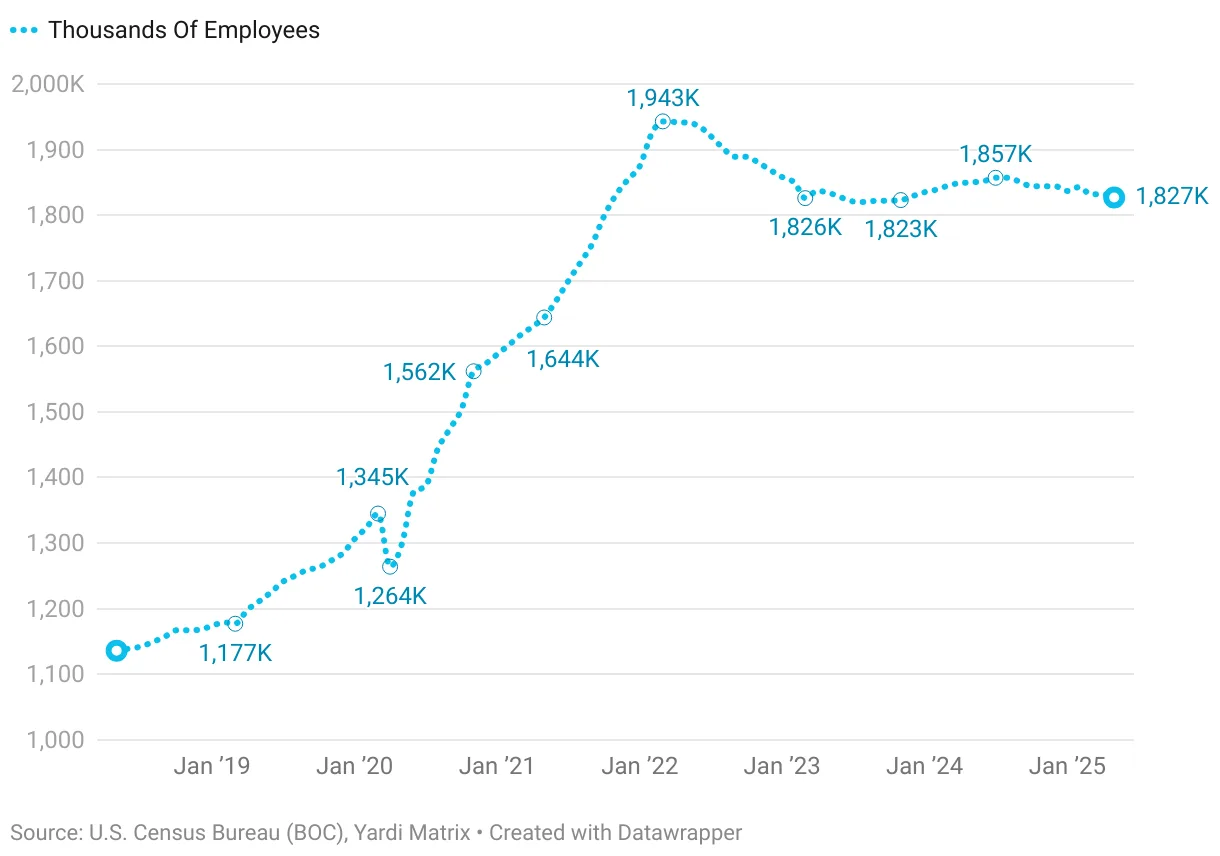
Labor Market Trends Signal Automation Ahead
Warehousing employment fell by 5,100 jobs in May, continuing a downward trend. Though wages are up 14% over three years, employers are expected to invest more in automation and supply chain optimization rather than workforce expansion in the near term.
Outlook
Trade policy will remain a critical determinant of industrial demand through the second half of 2025. With tariffs driving up materials costs and reshaping global logistics, developers and occupiers alike are adjusting expectations. As the market digests slower construction starts and new leasing patterns, flexibility in location strategy and inventory management will become vital competitive differentiators.