


- Foreclosure filings hit 187,659 in H1 2025, up nearly 6% from the same period last year, with foreclosure starts climbing 7%.
- Bank repossessions (REOs) increased 12% year-over-year, while the average foreclosure process timeline fell for the third straight quarter.
- Illinois, Delaware, and Nevada posted the highest state foreclosure rates; Lakeland, FL and Columbia, SC led among metro areas.
A Measured Climb
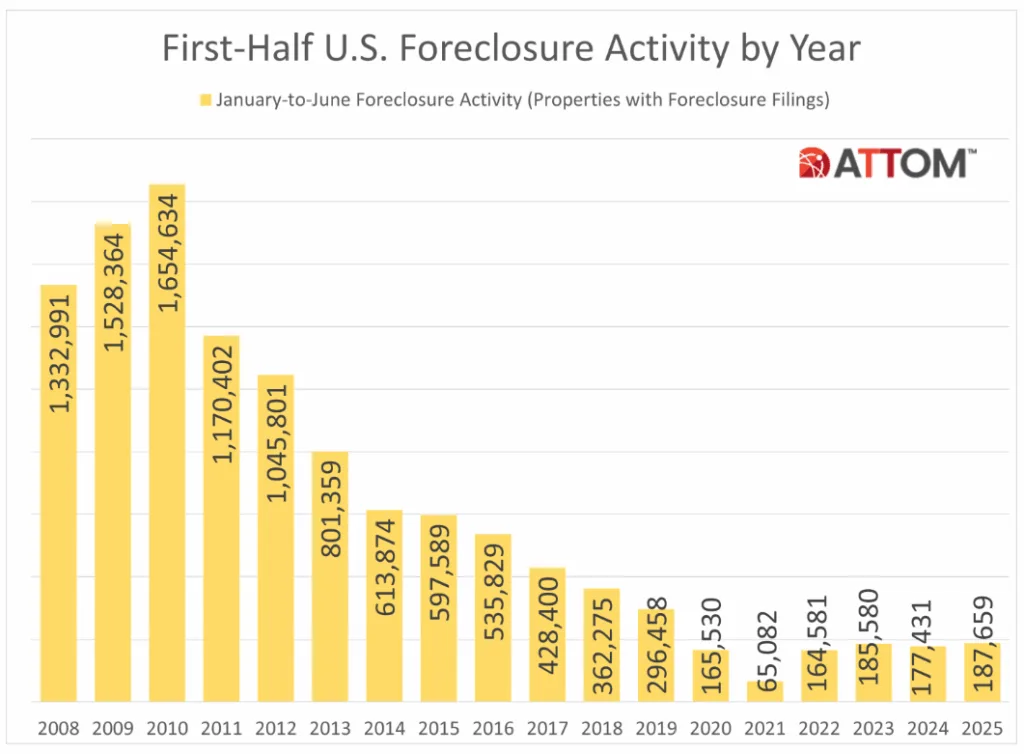
Foreclosure activity in the US edged higher in the first half of 2025, according to ATTOM’s latest Mid-Year Foreclosure Market Report.
Nearly 188,000 properties saw some form of foreclosure filing—whether through default notices, scheduled auctions, or bank repossessions. While still below pre-pandemic norms, the 5.8% increase from 2024 suggests ongoing financial pressure for some homeowners.
Foreclosure starts rose to 140,006, marking a 7% jump year-over-year, and a 41% increase compared to early-pandemic levels in 2020.
“While the overall numbers remain below pre-pandemic levels, the persistent rise suggests that some homeowners are still facing financial challenges,” said ATTOM CEO Rob Barber.
State and Metro Hotspots
Several states saw particularly steep increases in foreclosure activity. Alaska (+55%), Rhode Island (+51%), Wyoming (+46%), Utah (+46%), and Colorado (+41%) posted the largest year-over-year percentage gains.
When measuring foreclosure rates (filings as a share of housing units), Illinois and Delaware tied for the highest at 0.23%, followed by Nevada (0.21%), Florida (0.21%), and South Carolina (0.20%).
Among metro areas, Lakeland, FL led the nation with 0.29% of housing units in foreclosure. Columbia, SC and Chicago, IL followed closely behind at 0.28% and 0.26%, respectively.
Bank Repossessions and Process Times
REOs—properties repossessed by lenders—ticked up to 21,007 in the first six months, a 12% increase from the same period in 2024. The states with the most bank takeovers were Texas (2,207), California (1,799), and Pennsylvania (1,461).
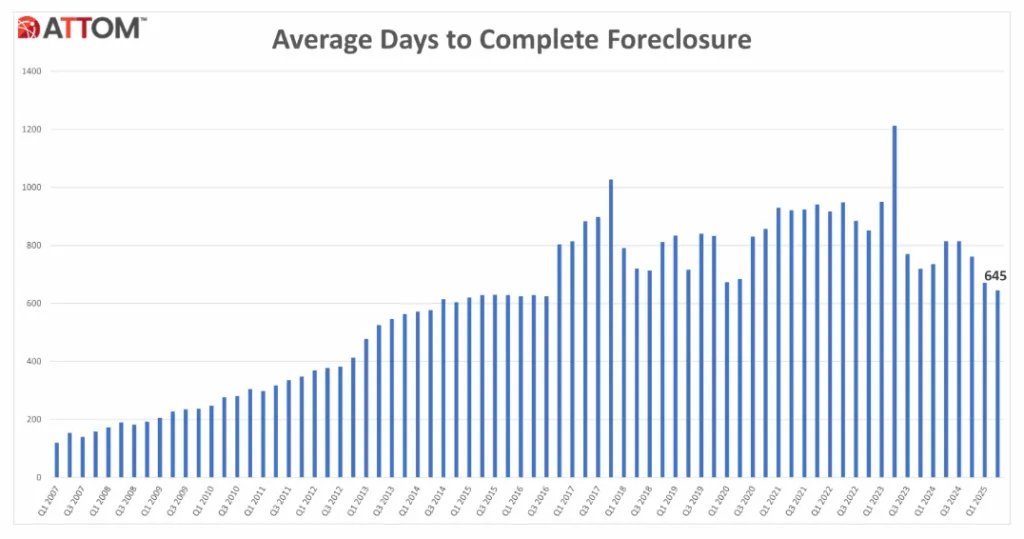
Foreclosures are moving more quickly through the system. The average time to complete a foreclosure dropped to 645 days in Q2 2025, down 21% year-over-year and 4% from Q1. Some states, however, continue to see lengthy timelines: Louisiana (3,612 days) and Hawaii (2,746 days) were among the slowest.
June and Q2 Snapshot
Foreclosure activity rose in both Q2 and June:
- Q2 2025: 100,687 properties filed, up 13% YoY.
- June 2025: 21,782 starts (up 17% YoY) and 3,892 completions (up 35% YoY).
States with the highest foreclosure rates in June included South Carolina, Nevada, and Florida.
Why It Matters
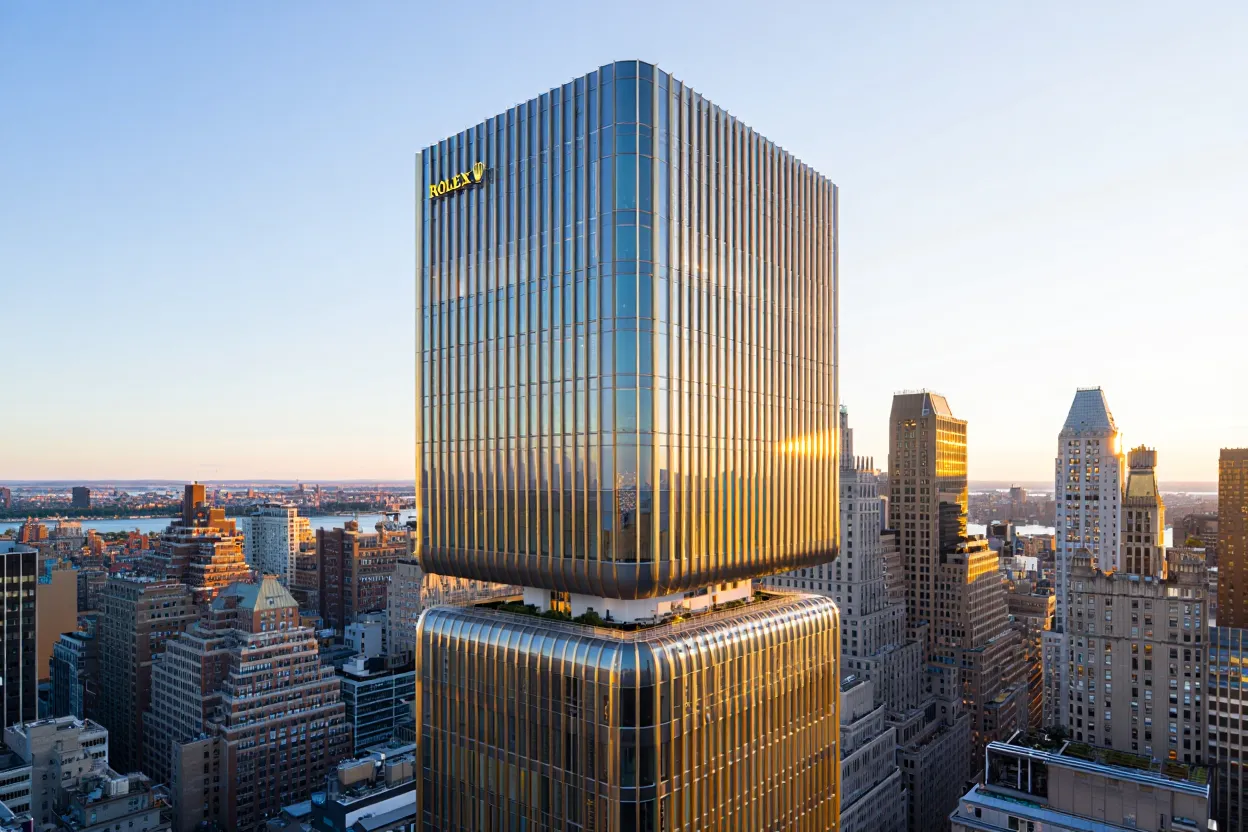
While current foreclosure volumes are far below the 2009 peak, the steady upward trend could signal increased strain from inflation, higher interest rates, or expiring pandemic-era assistance programs. Importantly, ATTOM notes that branded residences, while booming in some parts of the market, remain out of reach for many facing foreclosure—a reminder of the housing market’s widening affordability gap.
What’s Next
As average foreclosure timelines shrink and starts continue to rise, expect regulators, lenders, and investors to keep a close eye on distress indicators heading into 2026. For now, though, rising filings remain a slow burn rather than a wave.
Get Smarter about what matters in CRE
Stay ahead of trends in commercial real estate with CRE Daily – the free newsletter delivering everything you need to start your day in just 5-minutes