


- Transaction volume hit $150.6B, up 23.7% from Q2 and 25.1% year-over-year, marking the strongest quarterly performance since 2022.
- Median pricing reached post-pandemic highs, rising 2.9% quarter-over-quarter and 14.2% annually across all property types.
- Large deals are back, with $10M+ transactions reaching their highest count in three years, signaling a return of institutional capital.
- Multifamily, industrial, and office sectors led the rebound, while hospitality remained soft despite signs of stabilization.
Monetary Policy and Capital Market Context
Atlus Group reports that the Federal Reserve’s 25-basis point rate cut in September—the first of 2025—sparked broad-based optimism across capital markets. Investors welcomed signs of economic resilience, progress in disinflation, and AI-driven growth. Credit spreads narrowed, equity indices reached record highs, and bond issuance spiked, setting the stage for a rebound in CRE transactions.
National CRE Transaction Trends
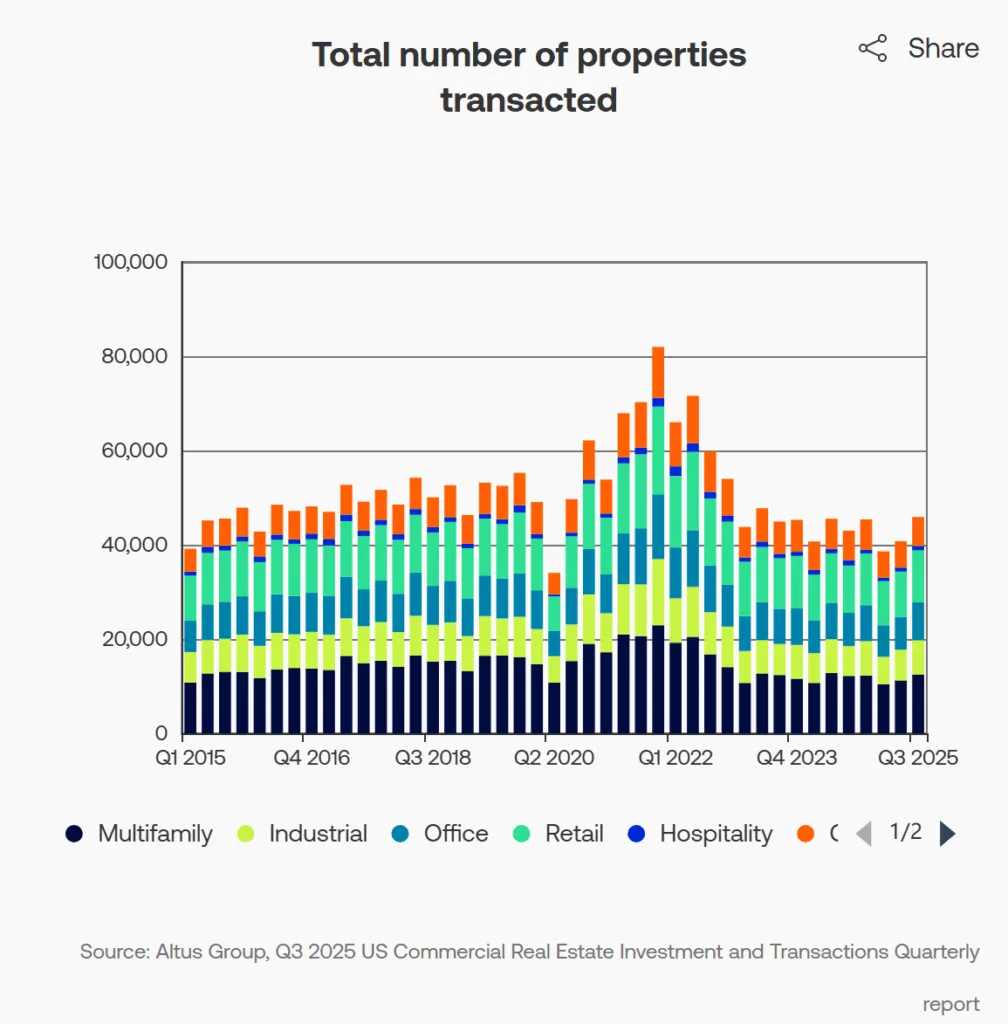
- Total volume: $150.6B, up 23.7% QoQ and 25.1% YoY
- Transaction count: 45,893 properties, a 12.6% quarterly and 6.8% annual increase
- YTD volume: $265B across 93,000 properties—outpacing both 2023 and 2024
Multifamily led the surge, with 51.1% YoY growth, accounting for 34% of single-asset dollar volume. Industrial (+26.5%), office (+28.0%), and general commercial (+48.9%) also outperformed. Hospitality remained the only major sector in decline, down 11.9% YoY.
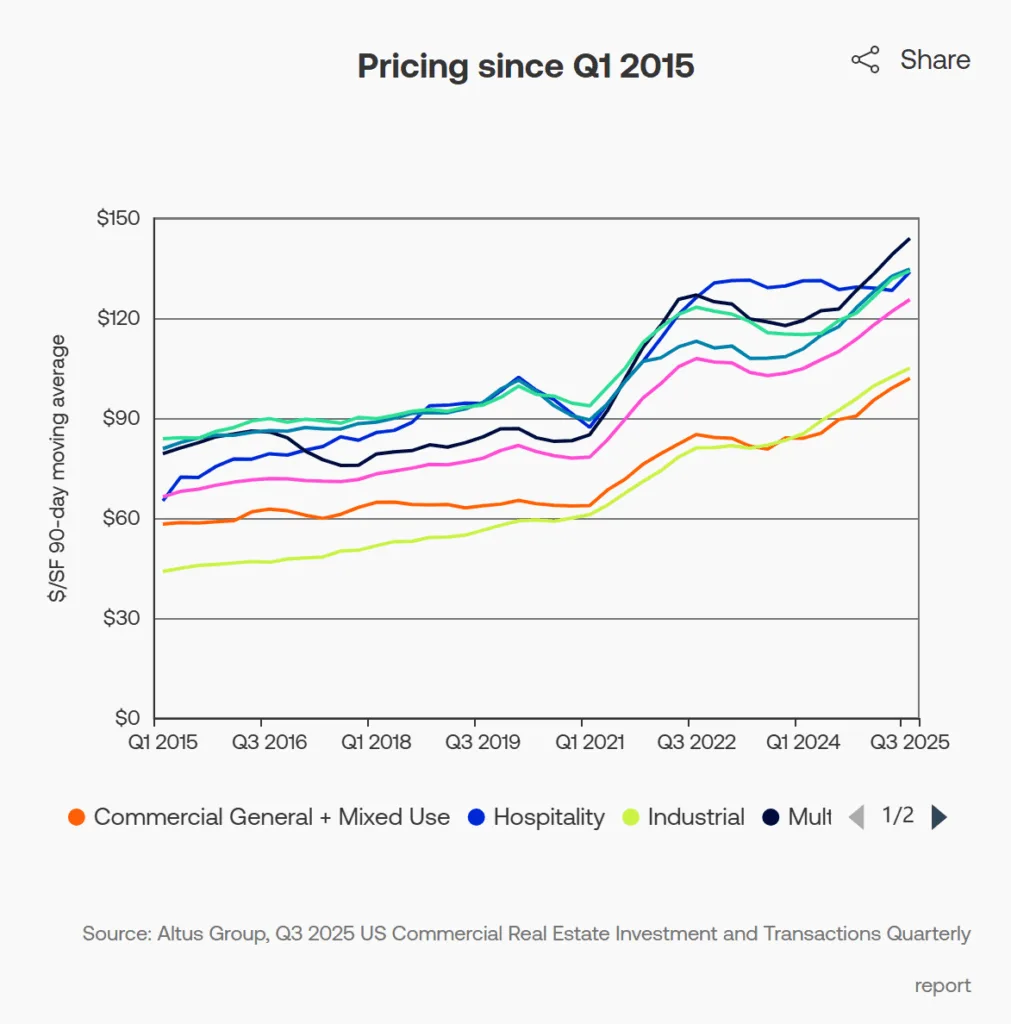
Pricing Trends: Post-Pandemic Highs
Median price PSF rose across nearly all subsectors:
- Multifamily: $144/SF, +17% YoY
- Industrial: $105/SF, +14% YoY
- Office: $135/SF, +15% YoY
- Storage: +8% QoQ, +17% YoY — sector leader
- Automotive: +5% QoQ, +19% YoY — strongest annual subsector gain
Only bars/restaurants (-2.4%) and big-box retail (-2.8%) posted quarterly declines. Deal size and building size also expanded, signaling greater investor appetite for larger, high-quality assets.
Market Dynamics by Sector
Multifamily:
- Highest transaction volume, +51.1% YoY
- Median pricing up 17.3% YoY
- Deal sizes jumped 27.3% YoY, with a focus on institutional-grade assets
Industrial:
- Continued steady growth, +26.5% YoY
- Storage was the standout subsector
- Demand remains high for last-mile and logistics facilities
Office:
- Showing early signs of selective recovery
- Medical office remains a premium asset class
- Median deal sizes +23.8% YoY
Retail:
- Mixed performance; automotive strong, big-box weak
- Overall pricing up 12.5% YoY
- Investor focus shifting to necessity-based and experiential formats
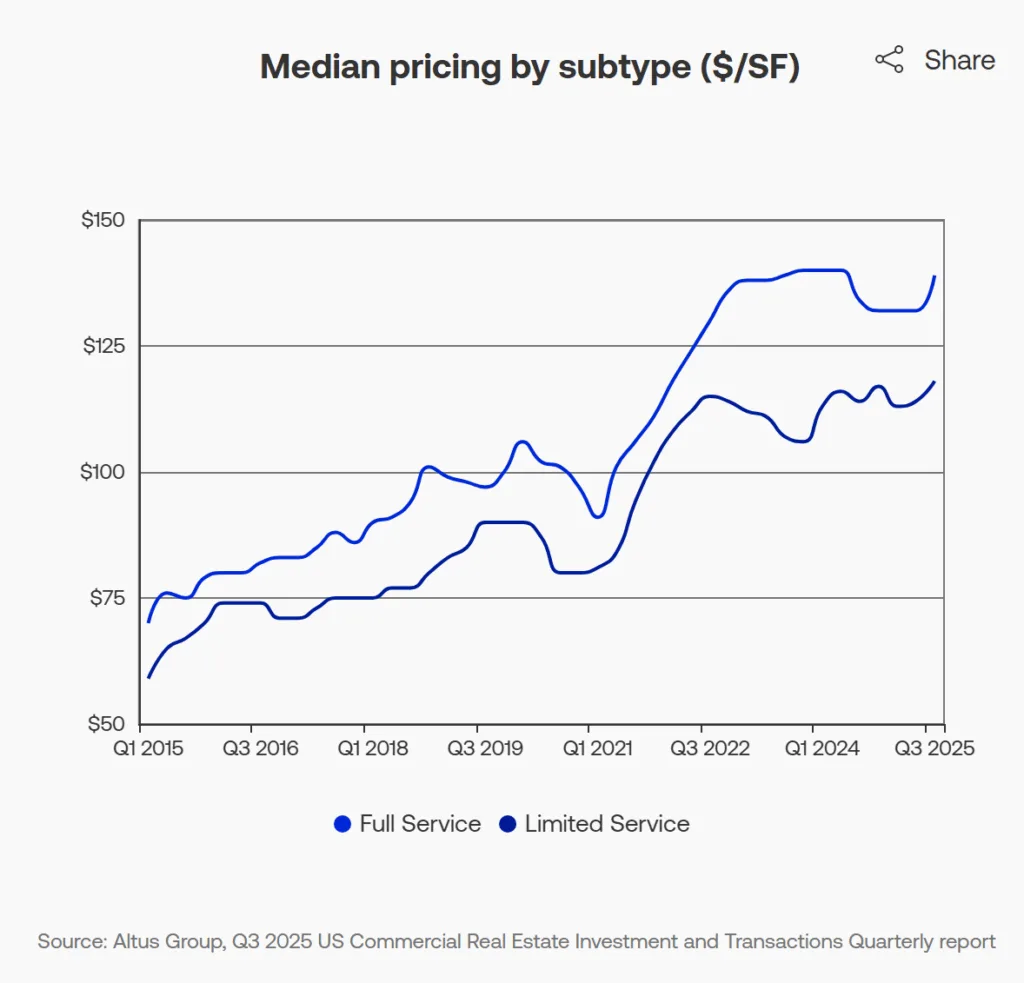
Hospitality:
- Weakest major sector but stabilizing
- Full-service hotels saw 5.2% QoQ pricing growth
- Transaction size and building size increased, favoring high-end assets.
Regional Performance and MSA Highlights
Southern markets dominated:
- Texas, Florida, and Carolinas far outpaced national averages
- Northeast corridor and Southern California underperformed
MSA standouts:
- Miami office: +32.7% YoY
- Los Angeles: broad sector price declines, e.g., office (-27.3%)
- Washington D.C.: diverging trends with office up (+22.5%) but multifamily down (-30.4%), reflecting how slowing deliveries in some markets are now beginning to influence pricing dynamics and investor positioning in multifamily
- Chicago, Atlanta, Dallas, and New York: gains across all major property types
Investor Sentiment and Capital Flow Trends
- Large deal activity surged to pre-2023 levels, signaling confidence from institutional buyers
- Median building sizes continued rising across sectors
- Financing conditions improved: CMBS issuance rebounded, bank lending picked up, and Fed surveys reported looser credit standards
- REITs and brokerage firms reported increased deal flow and improved outlooks on Q3 earnings calls.
Get Smarter about what matters in CRE
Stay ahead of trends in commercial real estate with CRE Daily – the free newsletter delivering everything you need to start your day in just 5-minutes
Looking Ahead: Q4 and 2026
Q3 2025 stands out as a potential turning point for CRE markets:
- Strongest Q2-to-Q3 transaction volume growth since 2021
- Historically, Q4 tends to outperform Q3—72% of the time over the last 25 years
- Market momentum suggests a strong finish to 2025, with growing alignment between buyers and sellers.
The Takeaway
Easing monetary policy, improved capital access, and renewed investor appetite point to a durable commercial real estate recovery heading into 2026.