


- The total CRE debt market stood at $4.9T in Q3 2025, exhibiting steady lender composition.
- Institutional lenders such as GSEs, securitized lenders, and insurers drove the most significant year-over-year growth.
- Banks maintained cautious but stable CRE exposure, reflecting ongoing regulatory pressures.
- Near-term maturities are concentrated among banks and securitized lenders, while GSEs and insurers hold mostly long-term debt.
CRE Debt Market Remains Stable
The commercial real estate (CRE) debt market ended Q3 2025 at $4.9T in outstanding balances, according to new Trepp research using Federal Reserve data. The overall market composition changed little even as financing costs remained elevated, with most lender categories showing modest growth in balance sheets.
Institutional capital—especially government-sponsored enterprises (GSEs), securitized lenders, and insurance companies—continued to deliver much of the incremental credit to the sector. Banks, meanwhile, remained conservative, growing their CRE portfolios at a slower but steady pace.
Institutional Lenders Drive Selective Growth
GSEs and securitized lenders each posted 7.3% year-over-year growth, while insurance companies expanded CRE holdings by 5.6%. Securitized lenders delivered the fastest quarter-over-quarter gains of any major lender group in Q3, up 3.7%. In contrast, banks only showed 1.7% year-over-year balance growth but have begun to show a stronger pace sequentially within 2025, as per Fed H.8 data.
Get Smarter about what matters in CRE
Stay ahead of trends in commercial real estate with CRE Daily – the free newsletter delivering everything you need to start your day in just 5-minutes
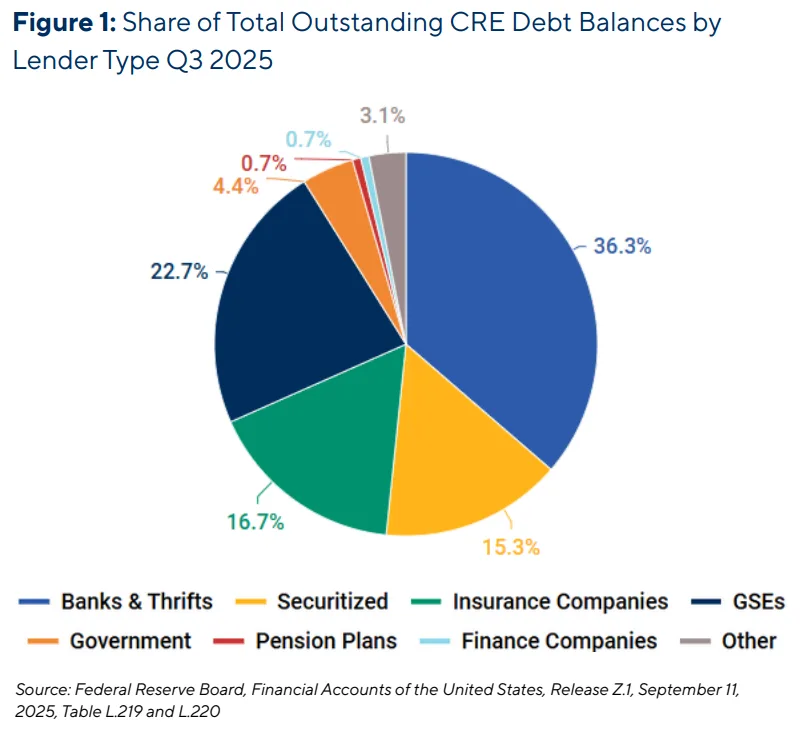
Where CRE Debt Sits
Banks and thrifts remain the backbone of the CRE debt market, holding $1.77T (36.3%) in outstanding balances at the quarter’s close. GSEs followed with $1.11T (22.7%), insurers with $816B (16.7%), and securitized lenders with $748B (15.3%). Institutional lenders’ contribution to the CRE debt market continues to shape the sector’s growth and stability.
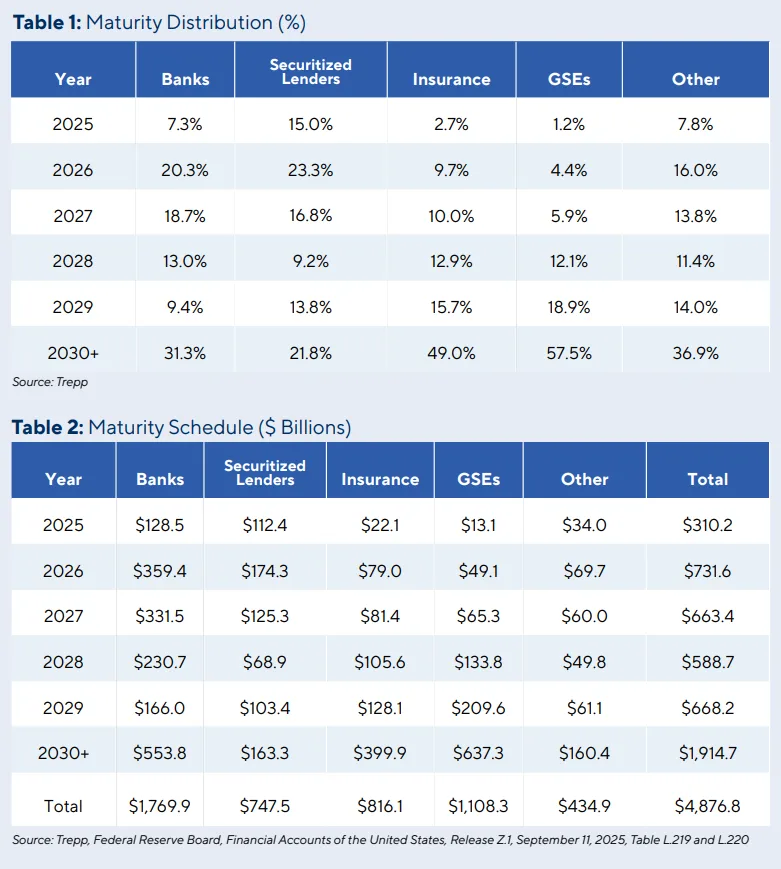
Maturity Profile Highlights Refinancing Dynamics
The distribution of CRE debt maturities highlights potential refinancing needs and varying stress points across lender types. Banks face about $488B in maturities through 2026—roughly 28% of their portfolio—with three-year median loan tenors. Securitized lenders will see about $286B mature (38% of total), making these two lender categories most exposed to near-term refinancing risks. GSEs and insurance lenders, by contrast, retain longer-dated debt, with the 2030+ bucket totaling nearly $1.9T. As a result, they face less immediate refinancing pressure, even as broader policy discussions continue around the future structure and oversight of the GSEs.
What’s Next
With the Federal Reserve’s first rate cut landing at the very end of September 2025, any relief on refinancing or new debt issuance will only become apparent in Q4 2025 and into 2026. The maturity landscape remains relatively stable, but capital availability and refinancing conditions will bear close monitoring as the impact of monetary easing moves through the CRE debt market.