


- Grocery-anchored retail continues to attract institutional capital, supported by limited new supply and consistent consumer demand, though sales volume has normalized post-pandemic highs.rn
- Transaction and securitization activity shows rising selectivity, with national grocer-anchored centers commanding better pricing, cap rates, and financing terms than those with regional or local tenants.
- $3.6B in grocery-anchored debt matures by 2026, with many assets facing refinancing pressure due to tighter margins, higher debt yields, and a lack of NOI growth.
The State Of Grocery-Anchored Retail
Grocery-anchored retail has emerged as a defensive CRE asset class amid broader retail turbulence, reports Trepp. The asset type benefits from its necessity-based nature, attracting foot traffic and investor interest even as retail fundamentals soften elsewhere. However, recent data from TreppCRE and TreppInsights underscores a bifurcated market: national grocer-anchored assets are drawing favorable terms, while properties backed by lesser-known regional and local tenants are facing increased underwriting scrutiny.
Get Smarter about what matters in CRE
Stay ahead of trends in commercial real estate with CRE Daily – the free newsletter delivering everything you need to start your day in just 5-minutes
Quality Over Quantity
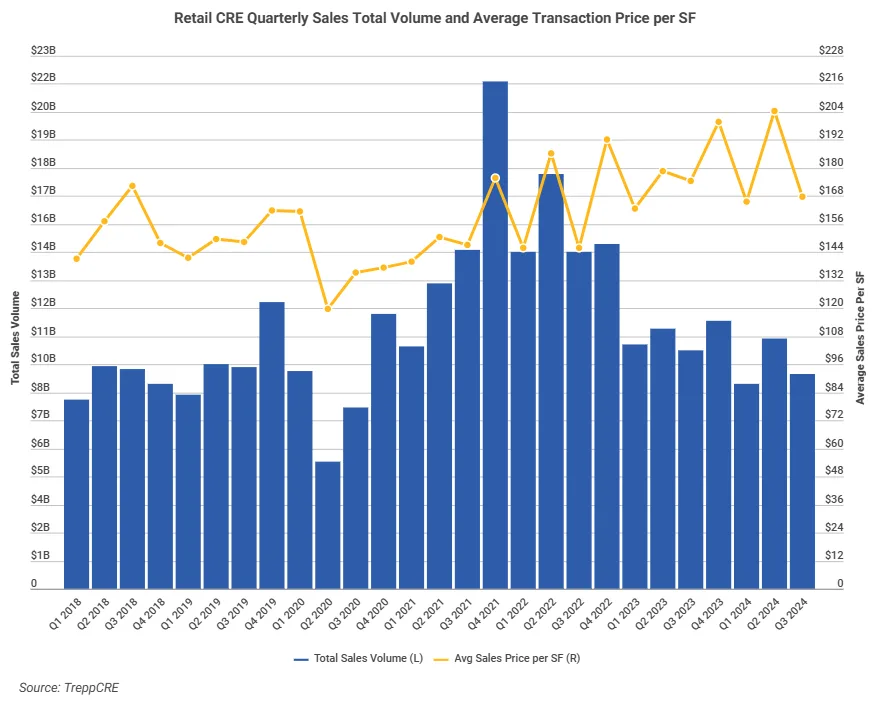
Although overall sales volume has cooled from pandemic-era peaks, pricing for grocery-anchored assets remains elevated:
- Retail sales peaked at $21.7B in Q4 2021, but averaged just $10B per quarter in 2023–2024.
- Average price PSF hit a record $204.37 in Q2 2024, before moderating to $167.64 in Q3.
- Institutional buyers remain active but are targeting higher-quality, tenant-secure assets.
 retail cre sales volume and average price per square foot from Q1 2018 to Q3 2024, highlighting volume decline and pricing increase.” class=”wp-image-58672″/>
CMBS Recovery Highlights Lender Preference for Stability
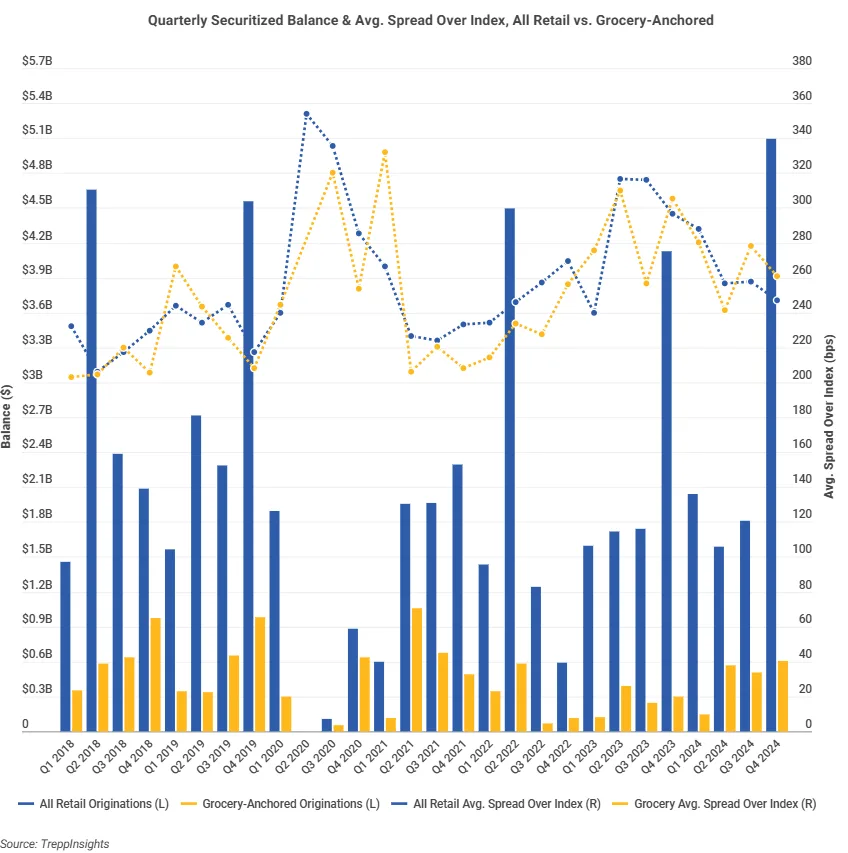
cmbs issuance for grocery-anchored assets has rebounded sharply, reflecting increased lender confidence in the subsegment:
- $604.8M in issuance in Q4 2024, up from just $122M in Q1 2023.
- $1.7B securitized over the past three quarters, marking the strongest stretch since early 2022.
- Issuance is increasingly concentrated in nationally anchored centers, which offer better lease terms, tenant credit, and operational durability.
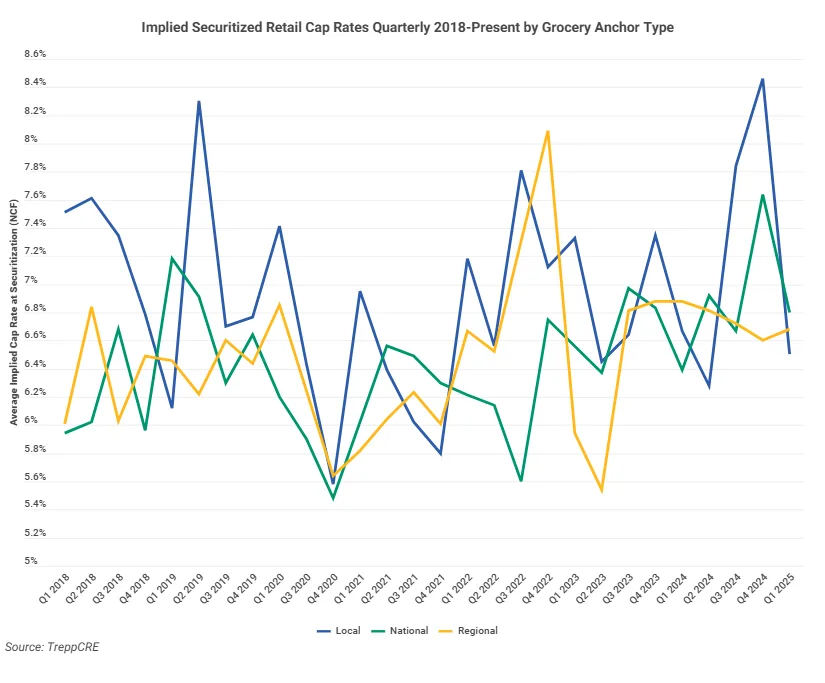
Cap Rates & Spreads Show Tenant-Driven Valuation Gaps
Valuation metrics continue to diverge across anchor types:
- National grocers: Cap rates held steady between 6.37%–6.80%.
- Regional anchors: Averaged 6.7%–6.9%, signaling moderate investor confidence.
- Local tenants: More volatile, with cap rates spiking to 8.46% in Q4 2024 before tightening to 6.50% in Q1 2025, indicating market reassessment of perceived risk.
Spreads mirror this differentiation:
- Grocery-anchored spread-to-Treasury: 260.74 bps
- All retail average spread: 247.27 bps
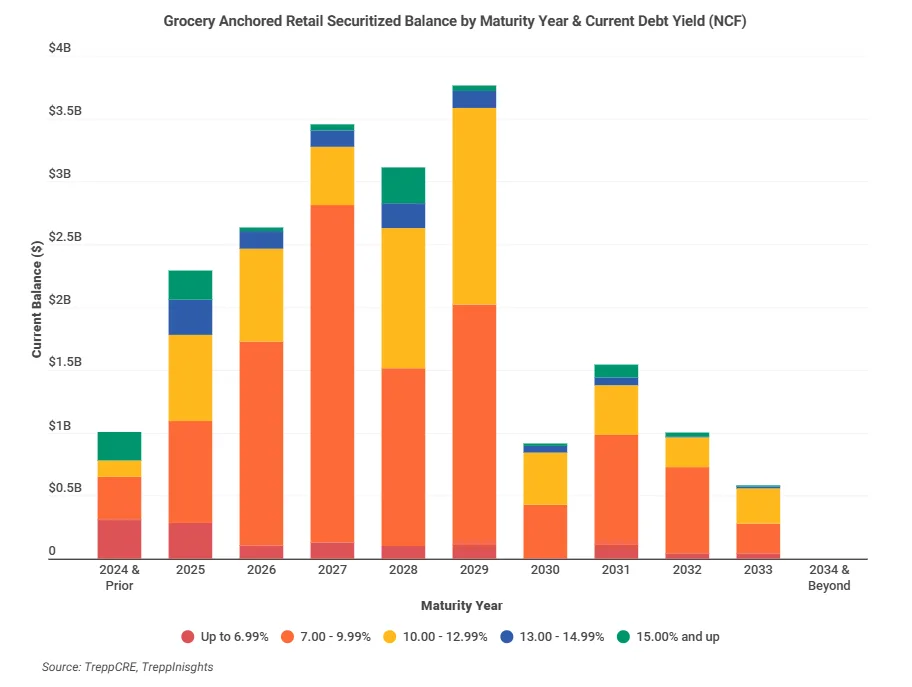
Refinance Risk Mounts As Maturities Approach
Despite stable occupancy and foot traffic, debt dynamics are adding pressure:
- Average grocery-anchored debt yield: 11.63% in Q1 2025, compared to 13.16% for overall retail.
- $3.6B in loans mature through 2026, with $2.5B carrying debt yields over 10%.
- Assets without cap rate compression or NOI growth may face lower refinance proceeds or require sponsor capital infusions.
Strength In Fundamentals, Risk In Execution
Grocery-anchored retail remains a top-performing retail subsegment, but underwriting is tightening. Assets with strong national tenants and durable cash flows continue to command premium valuations and attract capital. Meanwhile, properties with weaker anchors face rising cap rates, tighter debt terms, and growing refinance challenges.
What’s Next
Stakeholders need to differentiate between grocery-anchored assets by tenant quality, lease profile, and local market dynamics. Data-driven underwriting and risk-tiered capital allocation will be critical as retail CRE navigates a maturing cycle.