


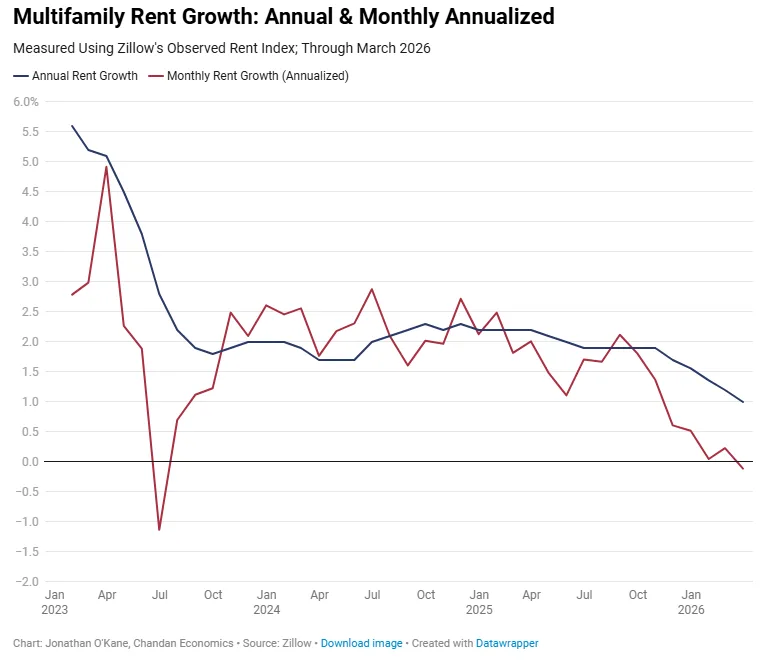
- National multifamily rent growth slowed to 1.0% year-over-year in March.
- Monthly momentum turned negative for the first time since June 2023.
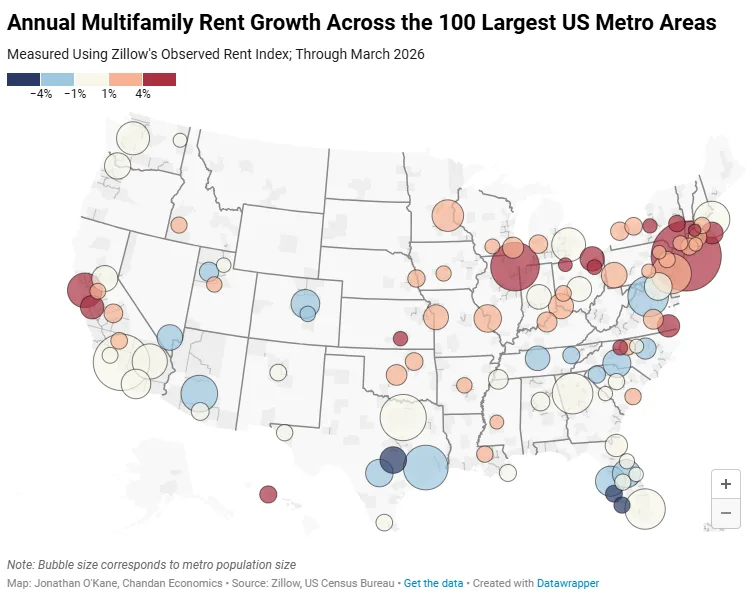
- Performance remains mixed, with Sun Belt metros lagging and Midwest/Northeast leading.
- More markets posted monthly rent gains in March, signaling some stabilization.
National Trends Signal Softening
According to Chandan Economics, multifamily rent growth in the US eased further in March 2026, with annual gains dropping to 1.0%—their lowest level since 2021. The pace continued to decline from 1.2% in February and 1.4% in January, marking an ongoing shift to calmer rental market conditions after marked post-pandemic gains.
Monthly rent momentum also weakened. National rents fell 0.1% in March, ending 32 months of positive monthly growth. Despite broadly stable levels, this marks the first monthly decline since June 2023.
Market Breadth and Regional Highlights
While rent growth slowed overall, March saw more metros post monthly increases—65.0%, up from 60.5% in February. Meanwhile, year-over-year gains were logged in 86.7% of metros, nearly unchanged month-over-month. Strongest annual rent growth was seen in Virginia Beach (+6.3%), San Francisco (+6.0%), and Toledo (+6.0%). Several Florida and Texas metros posted notable declines. North Port (−6.0%) and Cape Coral (−5.9%) led those losses. This uneven regional performance continues a pattern seen earlier in the cycle, when rent gains briefly stabilized before leveling off again across key markets.
Supply Pipeline and Absorption
The supply outlook is gradually improving. Despite a still-high volume of new deliveries impacting multifamily rent growth, the development pipeline is no longer expanding as rapidly. Renewed absorption will be critical for any return to stronger rent growth going forward.
Outlook: What’s Next
The overall rental market is now marked by minimal growth and divergence between markets. Sun Belt metros, especially in Florida and Texas, remain a drag, while the Midwest and Northeast show relative resilience. However, the uptick in metros with positive monthly multifamily rent growth, alongside a rebalance in supply, suggests the foundation for future stabilization may be forming.
Get Smarter about what matters in CRE
Stay ahead of trends in commercial real estate with CRE Daily – the free newsletter delivering everything you need to start your day in just 5-minutes