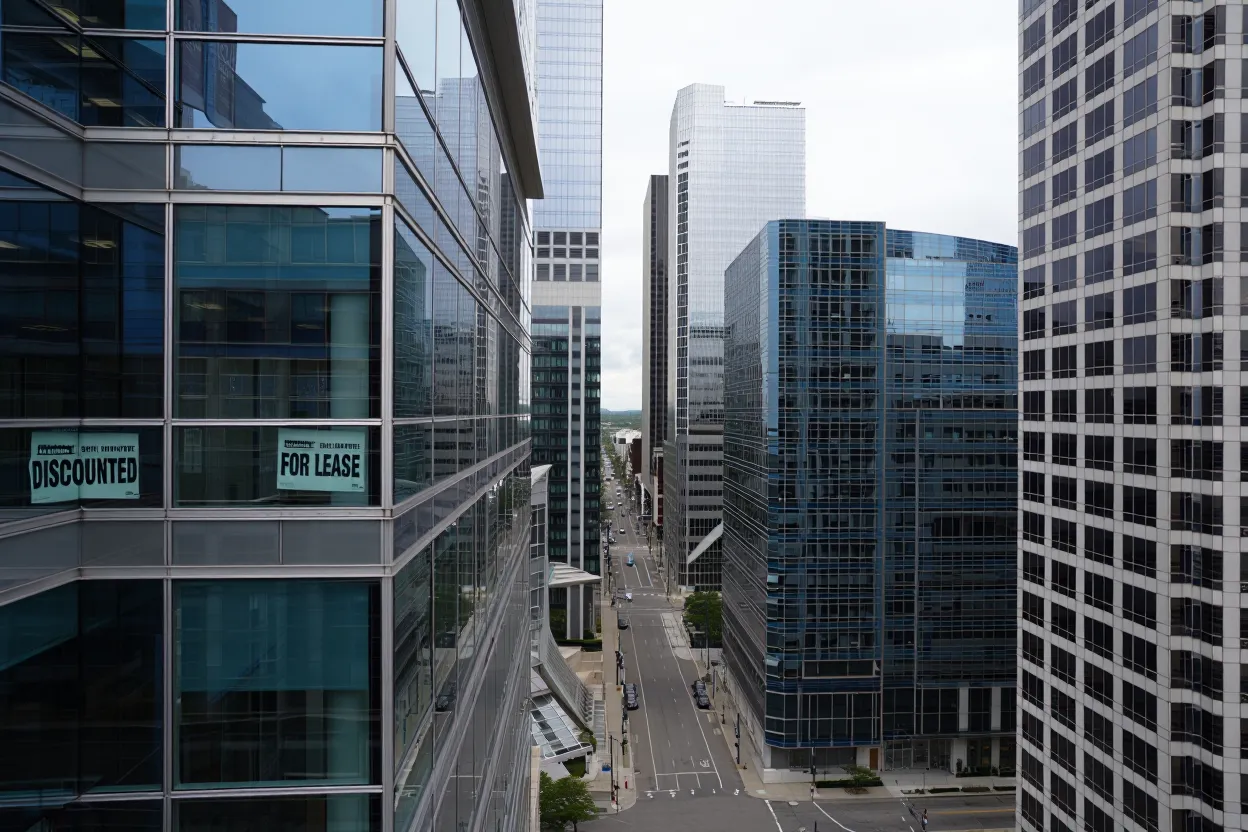


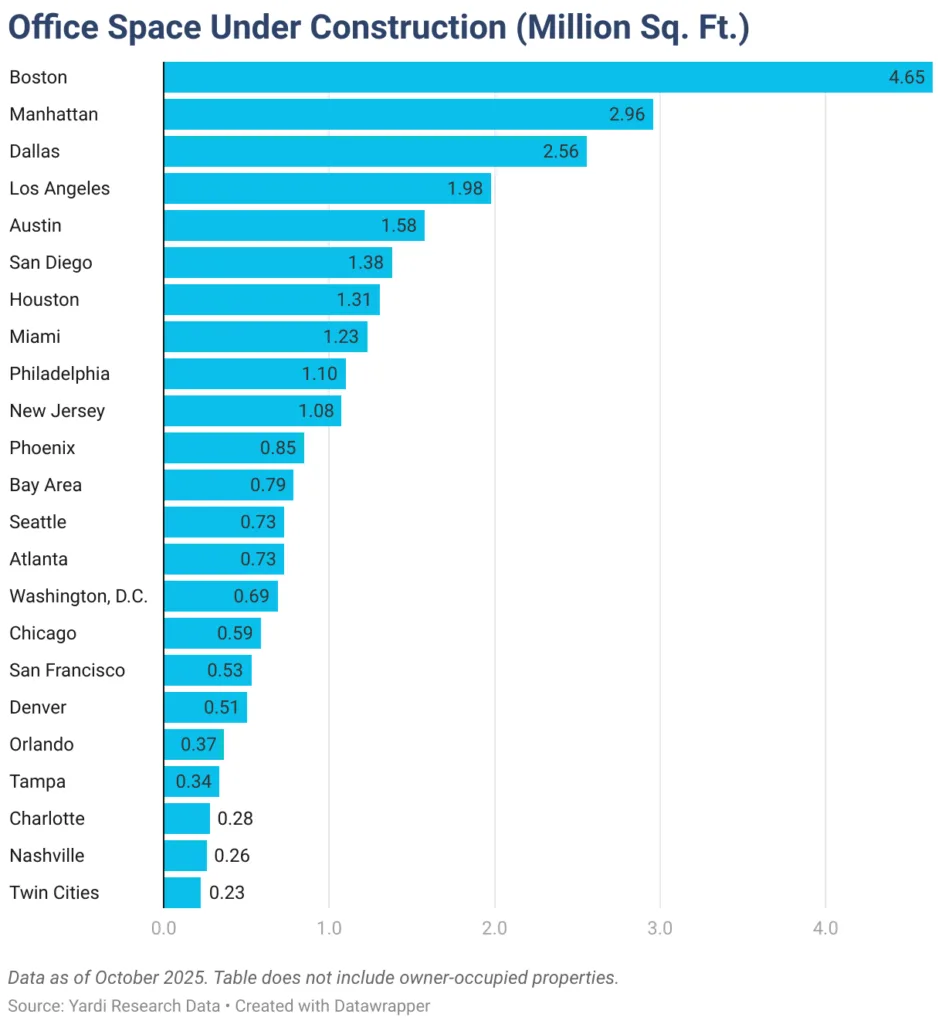
- Office construction remains limited nationwide, with just over 33M SF underway as of October 2025.
- Hybrid work continues to shape demand, keeping vacancy rates elevated and delaying a full return to pre-pandemic occupancy levels.
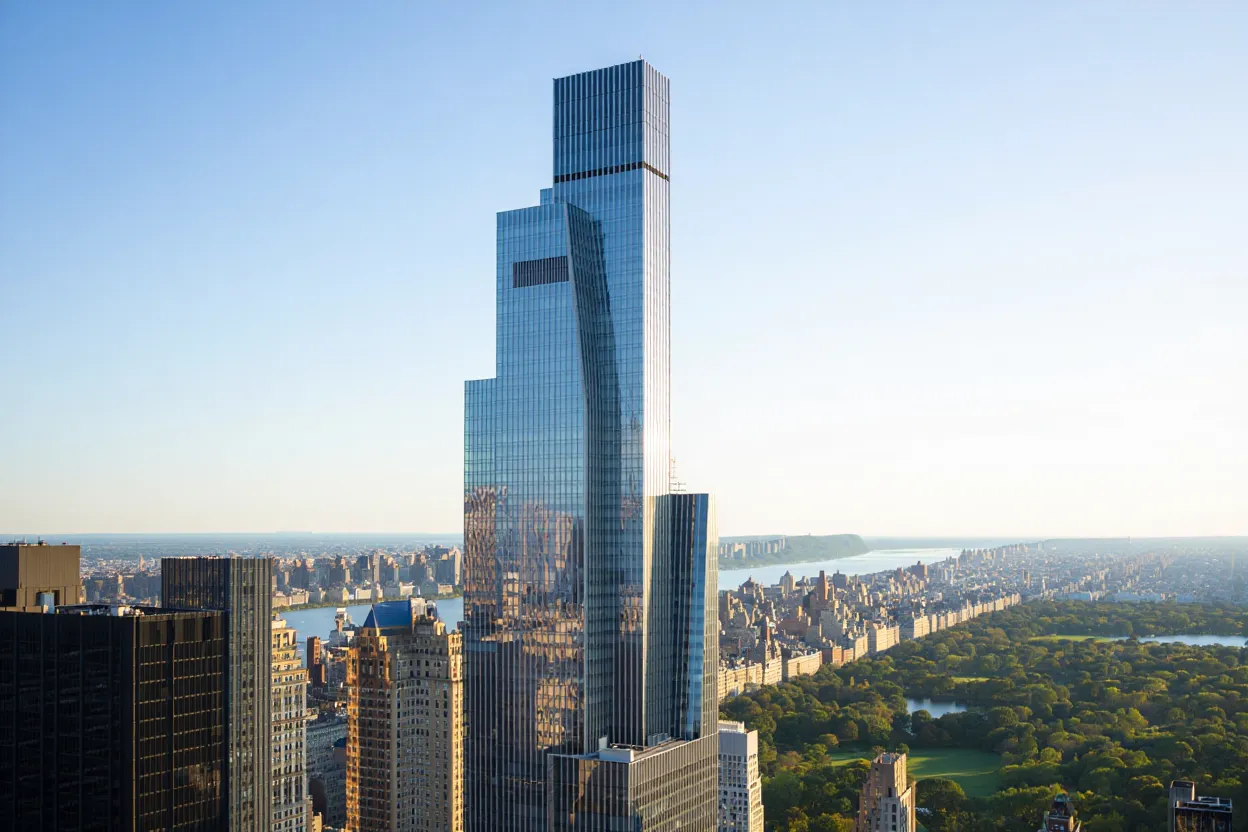
- High-cost markets like Manhattan and San Francisco lead in rents, while developers focus on trophy assets in prime locations.
- Investor interest remains strong in select metros, but price corrections are ongoing in challenged markets like Denver.
Developers Remain Cautious As Office Demand Stabilizes
The US office sector continues to face prolonged disruption, with developers keeping new supply tight, reports CommercialCafe. Nationally, just over 33M SF of office space was under construction in October, closely tracking 2024 figures. While this may seem stable, it underscores the broader slowdown that has followed the hybrid work revolution and rethinking of space needs.
In particular, developers are prioritizing high-end, amenity-rich assets over speculative builds. Markets like Los Angeles exemplify this trend, with a limited construction pipeline focused on trophy projects. One example is Century City Center, which has already secured major tenants such as CAA and Clearlake Capital.
Hybrid Work Keeps Pressure On Occupancy
Although more employees have returned to the office compared to 2021, full utilization is still elusive. Metros are adjusting at different speeds. For example, Austin had the highest physical occupancy among tracked cities in early November (74.6%), despite having the nation’s highest vacancy rate (26.9%) due to a development surge that outpaced absorption.
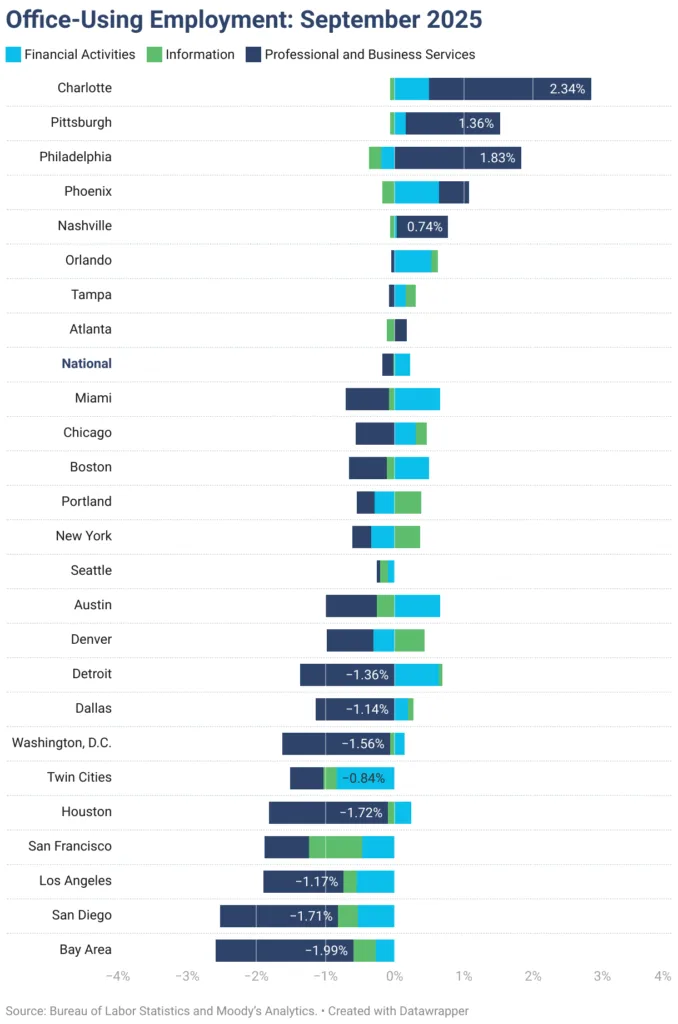
By contrast, Manhattan—where fewer residents work from home—posted one of the lowest vacancy rates (13%) among major office markets. The city’s aggressive strategy to reposition or repurpose obsolete buildings has played a key role in tightening supply and sustaining leasing interest.
Get Smarter about what matters in CRE
Stay ahead of trends in commercial real estate with CRE Daily – the free newsletter delivering everything you need to start your day in just 5-minutes
Market Fundamentals Show Uneven Recovery
Office listing rates nationally averaged $32.81 PSF in October—largely flat from the previous year. However, asking rents remain highly localized:
- Top Markets by Rent: Manhattan ($67.97), San Francisco ($65.30), and Miami ($56.34) led the nation.
- Lowest Rents: Detroit ($21.57), Houston ($27.49), and Orlando ($27.47).
Vacancy trends also varied widely. Western markets like Seattle (27.4%) and San Francisco (26.1%) continued to struggle, while Manhattan and Miami posted notably tighter rates near 13%.
Regional Highlights
Northeast: Manhattan and Boston dominated development and sales. Manhattan’s $6.4B in year-to-date sales was the highest in the US, and average sales prices reached $523 PSF. Boston led the region in office construction with nearly 4.7M SF underway.
South: Florida saw a wide range of performance. Miami had the region’s highest rents and lowest vacancy, while Orlando had some of the lowest asking rates. Austin and Dallas carried most of the South’s pipeline, but high vacancies persisted.
West: San Francisco topped rents but also struggled with high vacancy. The Bay Area led in regional sales volume, while LA stood out for trophy developments. Denver saw dramatic pricing corrections, with some assets selling at over 80% discounts from pre-pandemic highs.
Midwest: The Twin Cities maintained the lowest vacancy in the region (17.3%), while Chicago led in sales volume but had the lowest average price PSF at $64.
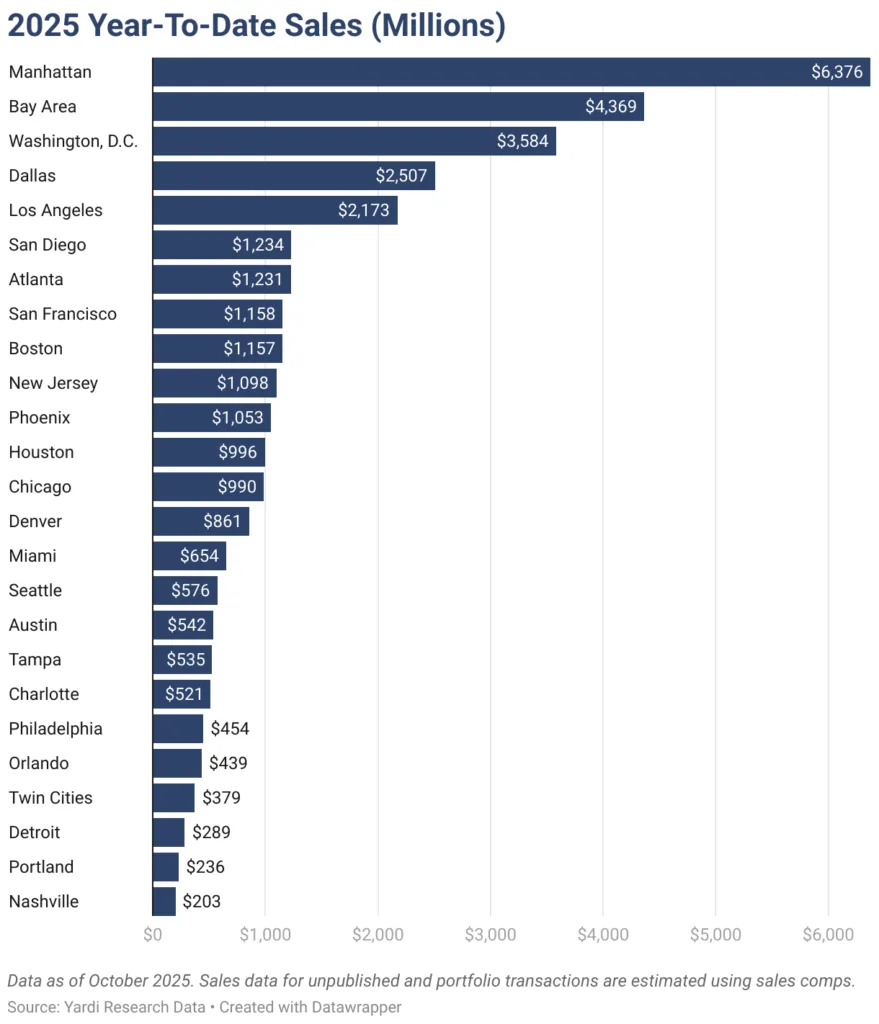
Investor Sentiment And Sales Trends
Nationally, $43B in office sales closed through October, averaging $191 PSF. Manhattan, the Bay Area, and Washington, DC, led in volume. However, some metros—like Denver—saw steep markdowns. Brookfield’s Denver assets, acquired for $400M in 2020, recently sold for just $58.4M.
Outlook
The office market’s recalibration is ongoing. Developers are increasingly focused on flexibility—embracing conversions, coworking formats, and mixed-use repositionings. While new construction is unlikely to surge in the short term, targeted, high-quality projects may continue to break ground in key metros where fundamentals remain resilient.
As hybrid work solidifies and local office dynamics evolve, expect continued divergence between winners and laggards in the national office landscape.