


- Renters make up ~35% of US households, a share that has remained steady over time, driven by affordability challenges and demographic shifts.
- The rental market is more than just apartments — with single-family homes, manufactured housing, and other alternatives playing a growing role.
- Housing demand and supply are misaligned, with affordability gaps most severe for extremely low-income renters, not across all income groups.
- Geographic variations are stark, with affordability crises concentrated in eight major metros while others remain relatively affordable.
Rentership Holds Steady
According to Principal Asset Management, US homeownership remains near its long-term average of 65%, with rentership accounting for the other 35% — a balance expected to persist. Despite some cyclical shifts over the years, demographic trends and affordability constraints suggest that rentership will continue to play a major role in housing demand, especially among adults aged 25–54 and seniors over 70.
More Than Apartments
Apartments represent just part of the rental landscape. According to NMHC data, only 39% of renters live in larger multifamily buildings (5+ units). A comparable share rent single-family homes, with others living in duplexes, triplexes, or manufactured housing. In rural areas, manufactured housing accounts for 13% of all rentals — highlighting how housing needs and types differ across geographies.
Senior housing, dormitories, and assisted living — often overlooked in standard data — also represent meaningful slices of rental demand.
The Housing Gap Isn’t Uniform
Yes, the US has a housing shortage — but it’s nuanced. The shortfall is overwhelmingly concentrated among extremely low-income households. Middle- and higher-income renters generally have access to sufficient housing stock, albeit not always in ideal locations.
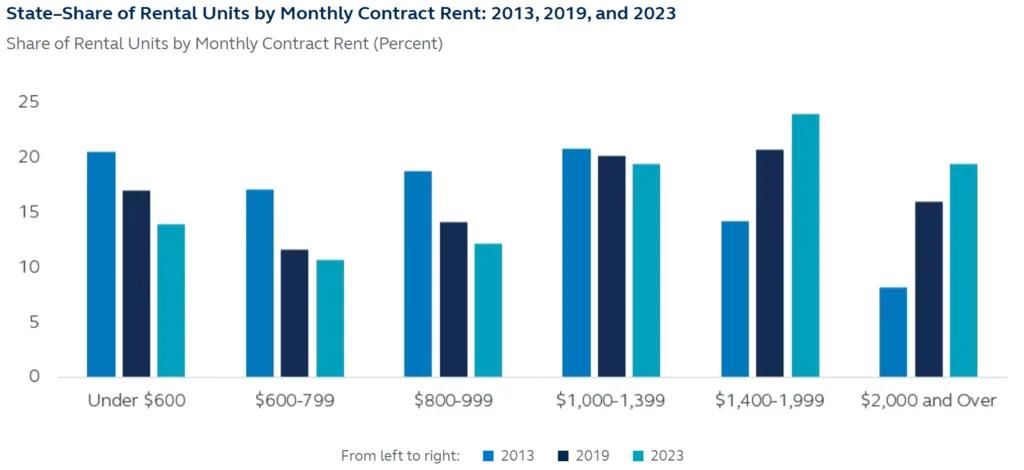
From 2013 to 2023, most markets saw a shortfall in housing relative to household formation. However, the nature of new supply — typically skewed toward high-end Class A properties — has left gaps in affordability and accessibility, even where unit counts appear balanced.
Get Smarter about what matters in CRE
Stay ahead of trends in commercial real estate with CRE Daily – the free newsletter delivering everything you need to start your day in just 5-minutes
Cost Pressures Limit Affordable Supply
Despite demand for lower-cost units, new construction remains expensive due to land, labor, and material costs — which don’t differ significantly between Class A and Class B or C units. This means developers must charge premium rents to meet return targets.
Older buildings that could offer lower rents often “filter up” rather than down if reinvestment keeps them competitive, causing a gradual erosion in affordable inventory.
Affordability Gaps by Market
The affordability crisis is most acute in coastal and gateway cities. In San Francisco, New York, Boston, and other metros, renters often need six-figure incomes to comfortably afford rent. In contrast, more affordable cities like Buffalo, Louisville, and Oklahoma City require annual incomes under $60,000 to stay below the 30% rent-to-income threshold.
According to Zillow, in six of the eight priciest metros, median renters now spend over 30% of income on housing.
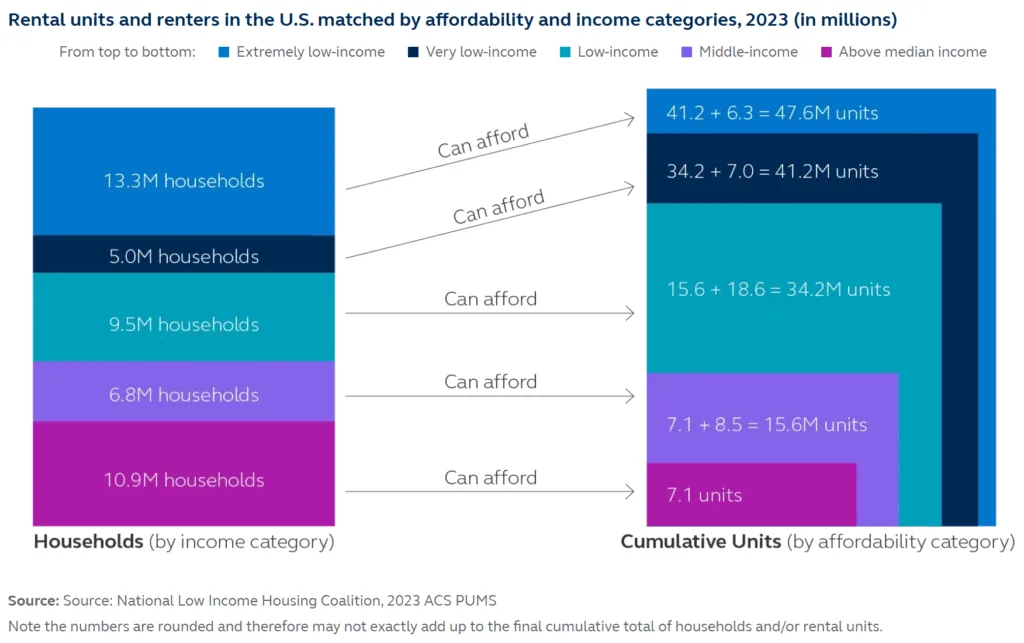
Data Snapshot: Who’s Competing for What
- Extremely low-income renters (≤30% AMI): 10.9M households compete for just 3.8M affordable units — a shortage of 7.1M homes.
- Very low-income (≤50% AMI): 6.8M households compete with ELI renters for a combined 15.6M units.
- Middle-income renters (81%–100% AMI): Face the least mismatch, with access to over 41M units — both affordable and market-rate.
This breakdown underscores why affordability issues disproportionately impact the lowest-income households.
Conclusion: A Fragmented Problem Requires Local Solutions
The US housing challenge isn’t just about building more homes — it’s about building the right homes in the right places. Rentership will remain a foundational piece of the housing puzzle, but the market’s complexity demands a more tailored approach.
Developers, policymakers, and investors need to consider local demographics, housing types, and affordability levels when crafting solutions. There’s no silver bullet — but there is a clear path forward: align housing supply with actual demand to build a more equitable, accessible rental ecosystem.