


- CMBS distress rates declined slightly in September, with delinquency down to 8.59% and specially serviced loans at 10.63%, indicating a modest improvement in the overall market.
- Office assets remain the primary source of distress, while retail and hotel sectors show signs of recovery and industrial continues to outperform.
- CRE debt markets remain active, with $91.4B in YTD private-label CMBS issuance (up 26% YoY) and CRE CLO volumes jumping 234% to $22.7B, driven by investor demand for yield.
CMBS Distress Trends Show Modest Easing
As Q3 2025 wraps, new data from CRED iQ shows that distress in the CMBS market has ticked downward. September’s delinquency rate landed at 8.59%, down from 9.44% in August.
Special servicing rates also fell to 10.63% from 10.95%, pushing the combined distress rate to 11.28%, a modest improvement from last month’s 11.78% peak.
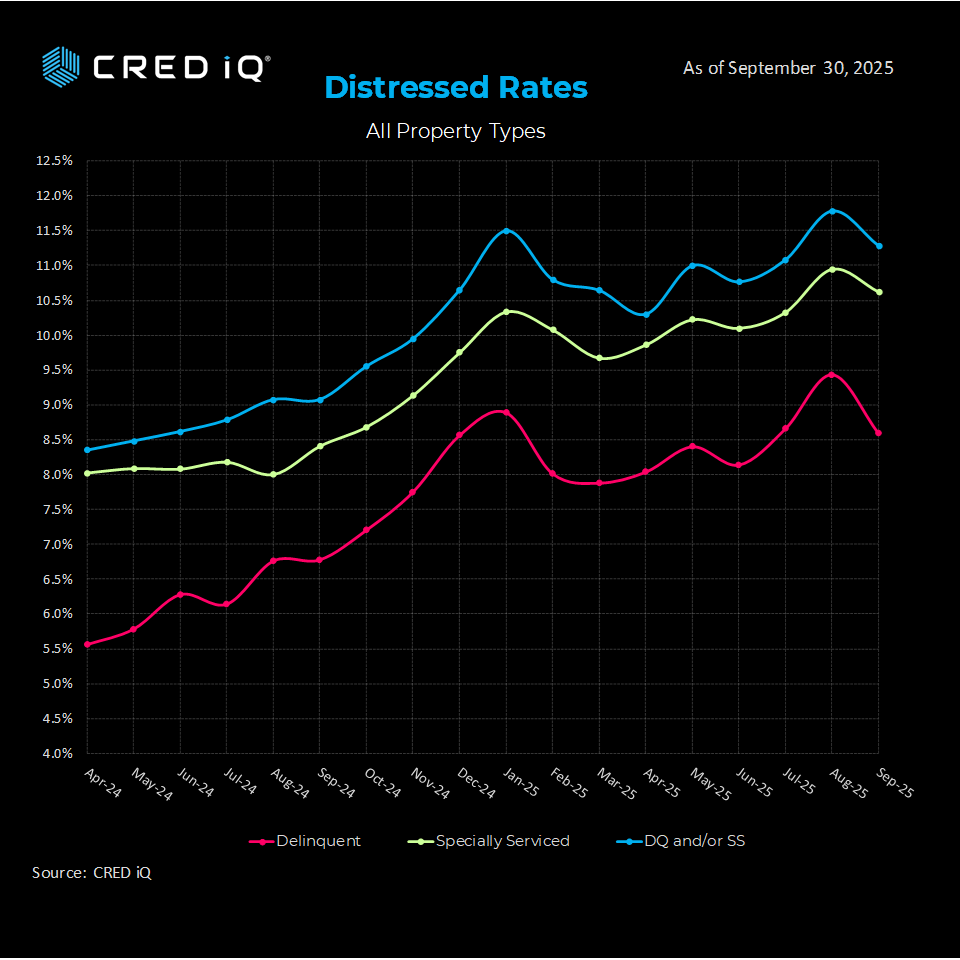
Still, distress levels remain historically elevated compared to pre-2024 levels, when combined rates hovered below 5%. Office properties continue to lead distress volumes, a trend that shows no signs of abating.
Sector Snapshot
CRED iQ’s latest property-type breakdown highlights stark performance differences:
- Office: Continues to bear the brunt of market stress, with elevated delinquencies and high special servicing rates.
- Multifamily: Faces rising distress but still outperforms office.
- Retail & Hotel: Showed relative improvement in September, aided by stabilized consumer spending and travel activity.
- Industrial: Remains the strongest-performing sector, buoyed by sustained e-commerce demand and tight logistics supply.
Debt Markets Stay Active Despite Headwinds
Despite elevated distress, issuance remains strong:
- Private-label CMBS: $91.4B YTD (+26% YoY), driven largely by single-asset, single-borrower (SASB) deals.
- Agency CMBS: Up 39% YoY to $105.7B, led by Fannie Mae and Freddie Mac.
- CRE CLOs: Up 234% YoY to $22.7B, reflecting investor appetite for higher-yield structured products.
CRE debt maturities are top of mind, with $957B in loans coming due in 2025, including $450B from banks and $230B from CMBS/CRE CLOs. Lending activity is shifting, with debt funds and REITs taking a larger share, rising to 14% in H1 2025, while agency market share dipped to 20%.
Macro Trends Support a Cautious Recovery Outlook
Recent economic signals offer a mixed but improving backdrop for CRE investors:
- Inflation: CPI has cooled to 2.9% YoY, nearing the Fed’s target.
- Interest Rates: The Fed’s target range is now 4.00–4.25%, following a series of rate cuts.
- Treasury Yields: The 10-Year sits at 4.18%, below recent highs but still above 2024 levels.
- Labor Market: Nonfarm payrolls grew by 22,000, while unemployment held at 4.3%—a sign of economic resilience, albeit modest.
What’s Next
Looking ahead, refinancing will remain a challenge for overleveraged assets, especially in office and transitional properties. With modest cap rate increases—now at 6.40% nationally—and only a 0.9% YoY gain in the CRED iQ CPPI index, asset values are stabilizing but not rebounding sharply.
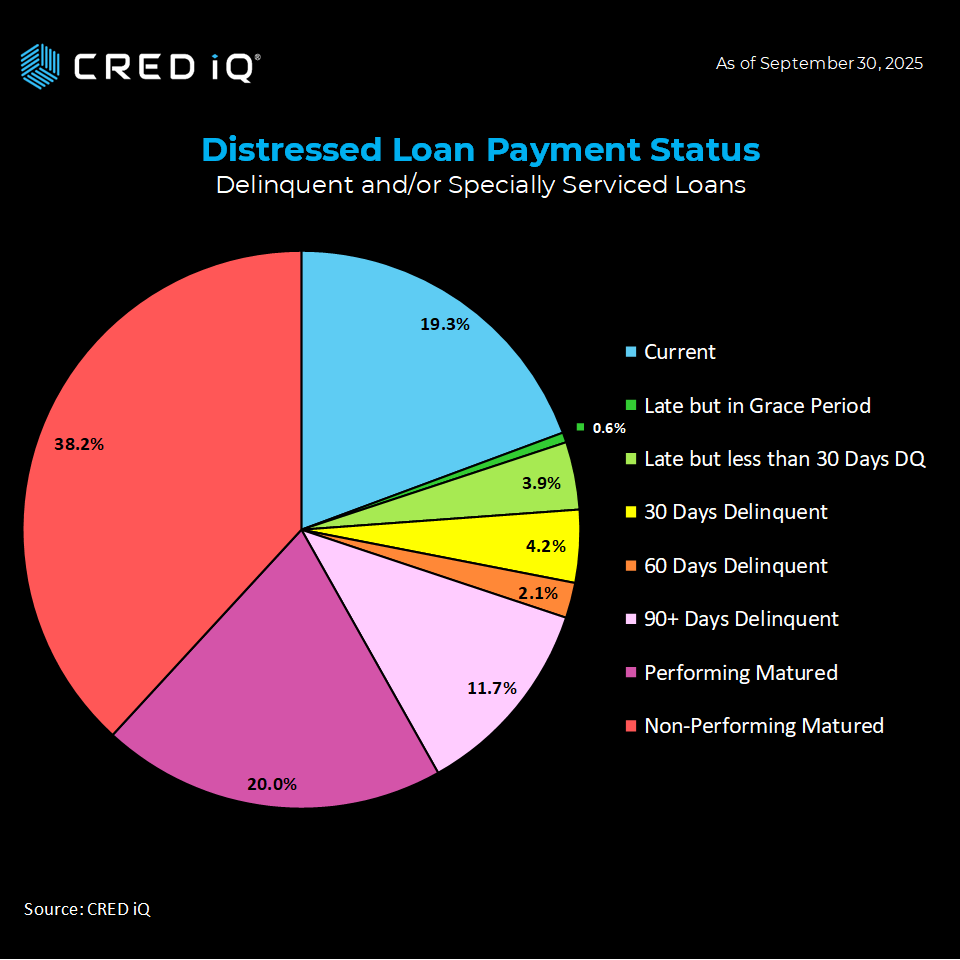
Investors are advised to stress-test portfolios for exposure to 2025–2026 maturities and watch for new transfers to special servicing, which could signal broader market weakness heading into 2026.
Get Smarter about what matters in CRE
Stay ahead of trends in commercial real estate with CRE Daily – the free newsletter delivering everything you need to start your day in just 5-minutes