


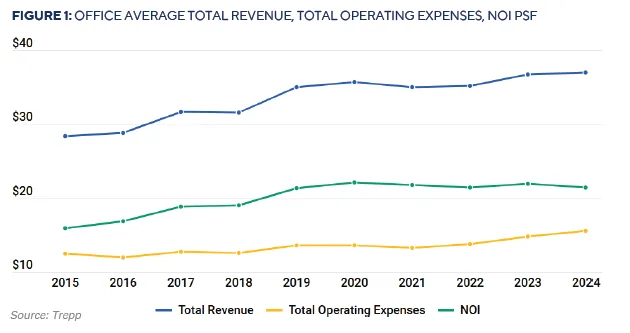
- National office revenue rose 30% over the past decade, but expenses climbed nearly as fast, compressing margins and revealing deep rifts between asset types and markets.rn
- Medical and government offices outperformed inflation, while urban and suburban offices stagnated or lost ground in real terms.
- Insurance costs nearly doubled, and real estate taxes grew unevenly across cities, with some markets like Dallas and Chicago seeing effective tax burdens jump by over 100%.rn
A Sector No Longer Monolithic
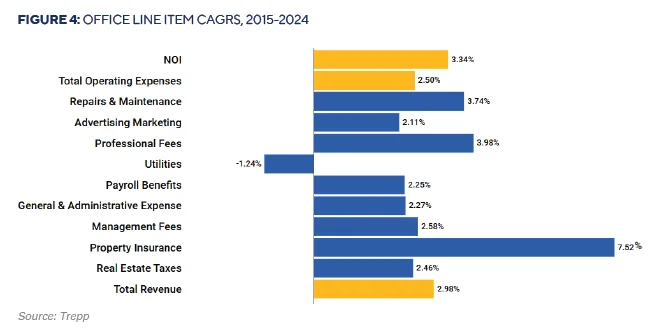
The US office sector has fractured into winners and losers, as reported by Trepp. According to a September 2025 report, national office revenue grew at a 2.98% annual rate from 2015 to 2024, while expenses increased 2.5%. net operating income (NOI) improved 3.34% annually. But averages conceal critical divergences that now define asset performance.
Subtype Divergence
Medical offices were the decade’s top performers, with revenue growing at 7.3% annually and NOI at 9.3%. Government offices followed, with NOI increasing by 6.2%. Urban offices barely kept pace with inflation, growing at 2.6%, while suburban offices posted just 1.2% annual revenue growth—negative in real terms.
Get Smarter about what matters in CRE
Stay ahead of trends in commercial real estate with CRE Daily – the free newsletter delivering everything you need to start your day in just 5-minutes
The Biggest Threat To Profitability
Insurance costs emerged as the steepest expense line, rising 92% over the decade—a 7.5% annual increase. Real estate taxes rose 24%, though the impact varied significantly by geography. Dallas saw a 127% rise in taxes as a percentage of revenue, while Houston’s ratio declined 28%.
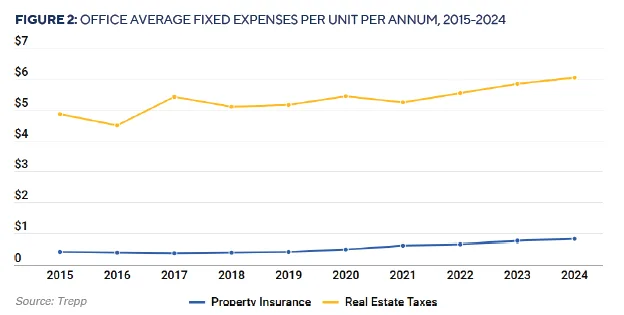
Together, insurance and taxes now consume more than 18% of office revenue, up from 16% in 2015.
Variable Expenses
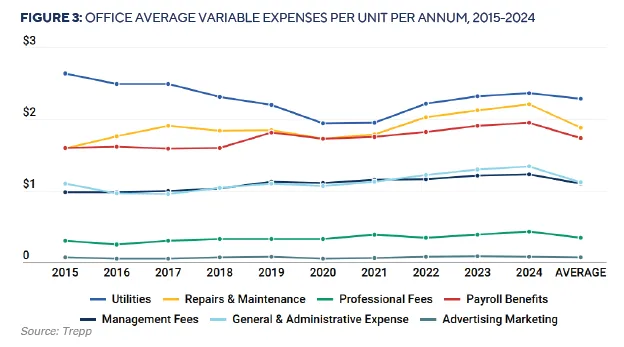
While utilities declined by 1.2% annually, other variable costs surged. Repairs and maintenance increased 39%, professional fees jumped 42%, and management fees rose 26%. These trends reflect higher compliance demands, tenant expectations, and capital needs.
SASB VS. Conduit
Assets backing conduit loans saw moderate growth: 3.3% in revenue and 3.6% in NOI. In contrast, single-asset, single-borrower (SASB) properties—often considered trophy assets—lost ground, with NOI declining 1.5% annually.
Flat rents and rising costs squeezed margins, shrinking the NOI premium between SASB and conduit properties from $23/SF in 2016 to just $8/SF in 2024.
Capital Markets React
Cap rates moved higher across the board. Conduit cap rates rose to 7.74% in 2025 from 6.12% in 2020. SASB cap rates widened to 6.78% from 5.18%, reflecting a repricing of risk and diminished premium for high-end assets.
Why It Matters
Operating performance now drives value more than cap rate compression. Each additional dollar of recurring expenses reduces value by more than $12 at current cap rates. Investors, lenders, and asset managers must shift toward granular underwriting, incorporating regional tax policies, expense inflation, and tenant mix.
What’s Next
Looking forward, three themes will shape office outcomes:
- Insurance Volatility: Particularly in coastal markets, insurance premiums show no signs of normalizing.
- Tax Policy Uncertainty: Markets like Chicago and Hartford show how reassessments can double tax burdens.
- Suburban Repositioning: Despite lagging revenue, suburban offices often have lower expenses—making them prime candidates for adaptive reuse or conversion to medical/government uses.