


- The national office vacancy rate stood at 18.7% in August, down just 80 basis points year-over-year, with some markets like Seattle and Austin still above 25%.
- Class A and amenity-rich offices continue to outperform the broader market, driving leasing demand in top urban cores.
- Construction activity remains sluggish, with only 10.7M SF of new office projects started year-to-date.
Flight-to-Quality Defines Leasing Trends
Despite ongoing uncertainty in the office sector, tenants continue to gravitate toward high-quality, amenitized properties, especially in top-tier markets, per Commercial Cafe.
This “flight-to-quality” trend has buoyed leasing in places like Manhattan, where demand hit a five-year high, even as national office utilization hovers around 50-55%.
Seattle (27.2%), Austin (26.5%), and San Francisco (25.9%) led in vacancy, reflecting a tougher environment for older and lower-tier assets in oversupplied or tech-reliant markets.
Listing Rates & Leasing Activity
The national average listing rate fell slightly to $32.63 PSF in August, representing a 0.4% year-over-year dip.
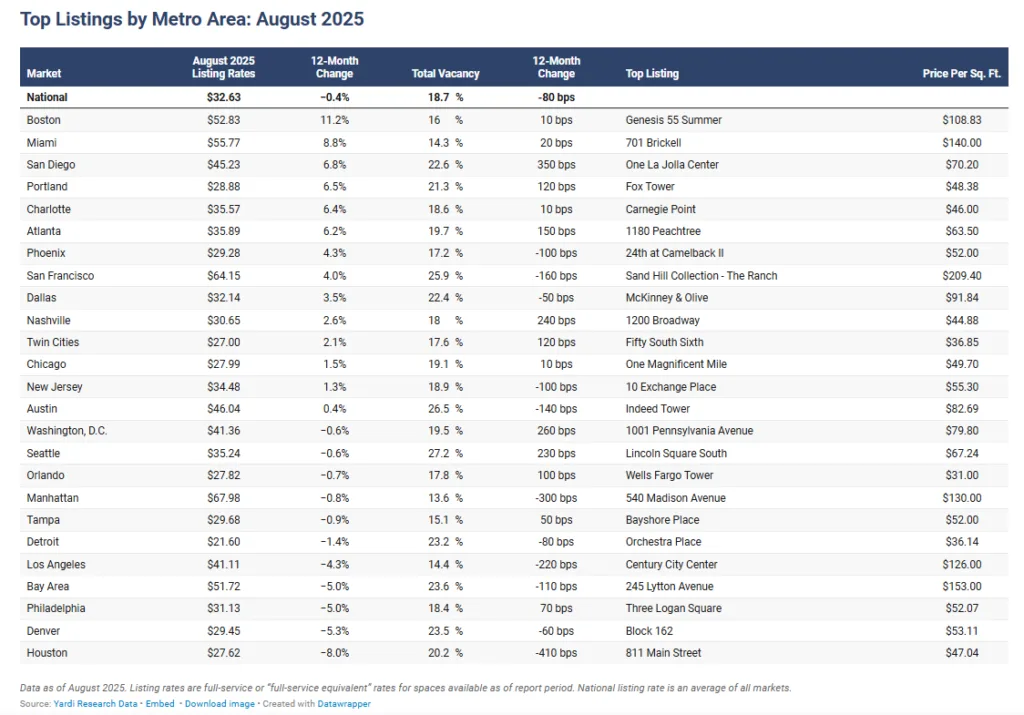
Still, top metros continue to outpace the average:
- San Francisco: $64.15/ SF
- Manhattan: $67.98/SF
- Miami: $55.77/ SF
Markets like Boston and San Diego also posted significant rate growth year-over-year, with Boston seeing an 11.2% increase, driven by demand for high-end space.
Sales Activity: Trophy Assets Drive Value
Year-to-date, office transactions totaled $33B, with an average sale price of $190 PSF—still below the pre-pandemic peak of nearly $280/ SF in 2019.
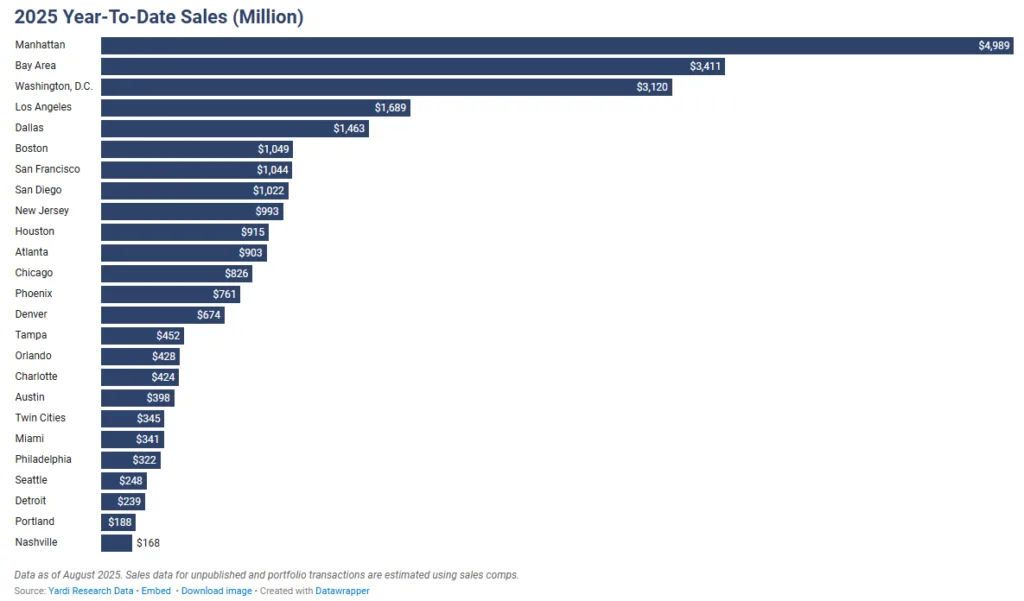
Top metro sales volumes through August included:
- Manhattan: $4.99B
- Bay Area: $3.41B
- Washington, D.C.: $3.12B
In Dallas, prices rose dramatically year-over-year, fueled by high-quality sales like The Link at Uptown, which sold for $218M or $240/SF, up from $107 in 2024.
New Construction Remains Limited
The national pipeline remains modest, with just over 40M SF of office space under construction as of early September—less than 1% of total inventory. Deliveries so far in 2025 totaled 17.3M SF, while construction starts reached just 10.7M SF for the year.
Top metros for office starts include:
- Manhattan: 3.35M SF
- Boston: 5.56M SF (most active pipeline)
- Dallas: 2.72M SF
Regional Highlights: Western US
- Seattle posted the highest vacancy at 27.2%.
- San Francisco led in asking rents at $64.15/SF.
- Bay Area had the priciest office sales at $378/SF.
Midwest
- Twin Cities saw a 2.1% Y-o-Y increase in rents ($27/SF).
- Detroit remained the most affordable at $21.60/SF
- Sales prices were lowest in Chicago at just $60/SF
South
- Washington, D.C. led in YTD sales volume ($3.1B).
- Miami was the region’s priciest leasing market ($55.77/SF) and posted the highest sales price at $250/SF.
- Dallas and Austin drove construction activity.
Northeast
- Manhattan dominated both construction and sales, with 3.35M SF underway and $4.99B in sales.
- Boston surpassed $1B in YTD sales and had the largest pipeline at 5.56M SF.
Employment & Market Outlook
Office-using employment remained flat year-over-year, with key declines in California markets due to tech sector pullbacks. The Bay Area, San Francisco, and San Diego all posted Y-o-Y employment declines of more than 2% across information, finance, and business services sectors.
With many companies continuing hybrid work models and occupancy plateauing, experts expect continued pressure on underperforming assets. However, best-in-class buildings in core locations are likely to see continued demand and investor interest.
What’s Next
While much of the market continues to adjust to post-pandemic dynamics, high-quality assets are still generating demand—especially in supply-constrained urban centers. Going forward, expect a continued focus on renovation, repositioning, and rightsizing rather than speculative new development.
As the sector stabilizes, successful properties will likely be those that blend location, amenities, and flexibility, meeting tenant expectations in a transformed office landscape.
Get Smarter about what matters in CRE
Stay ahead of trends in commercial real estate with CRE Daily – the free newsletter delivering everything you need to start your day in just 5-minutes