


- Transaction volume reached $115B in Q2 2025, up 3.8% year-over-year, led by multifamily (+39.5%) and office (+11.8%) deals.
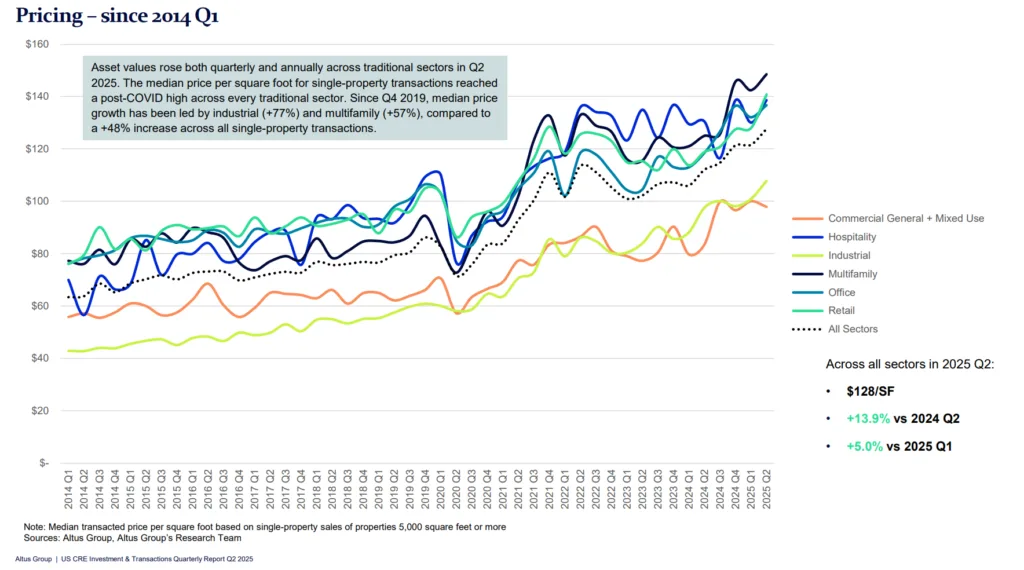
- Pricing surged, with the median price PSF climbing 13.9% annually, led by multifamily, retail, and office.
- Hospitality and retail underperformed, while subsectors such as bars & restaurants, automotive, and storage saw the strongest YoY price growth.
- Metro trends diverged, with most coastal markets outperforming, but New York and San Francisco lagging behind the national average.
A Modest Rebound in CRE
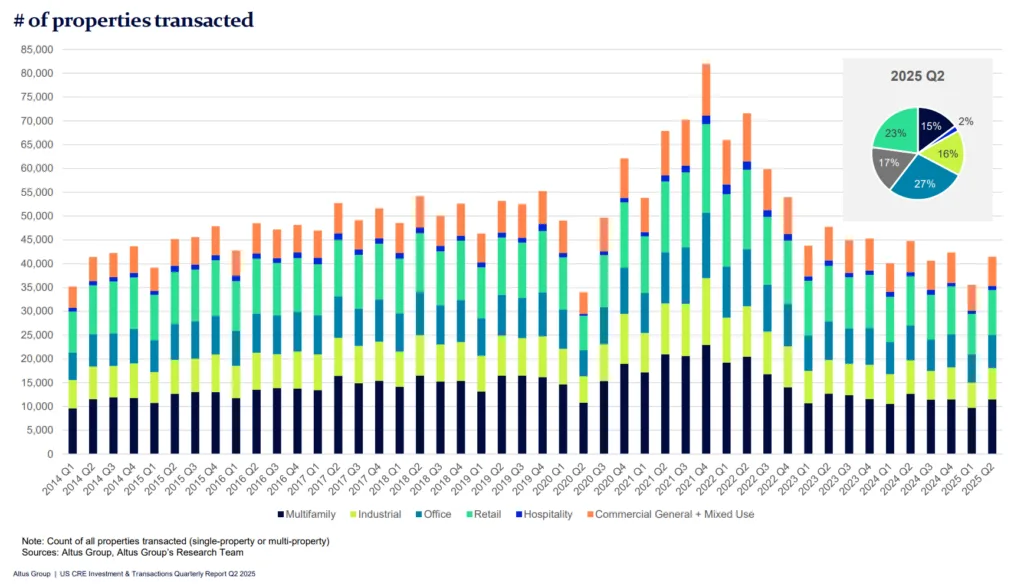
US CRE investment sales edged higher in Q2 2025, according to Altus Group’s quarterly report. Aggregate transaction volume hit $115B, a 3.8% increase from the same quarter in 2024. The recovery was concentrated in multifamily and office, which together represented nearly half of all deal activity.
Sector Breakdown
- Multifamily: $34.1B in sales (+39.5% YoY), the strongest contributor to growth.
- Office: $16.7B in sales (+11.8% YoY), with medical office leading pricing gains.
- Industrial: $18.8B (-6.3% YoY), with warehouse/distribution pricing still up 10% annually.
- Retail: $17.6B (-14.2% YoY), though bars & restaurants saw standout price growth (+42.2%).
- Hospitality: $4.4B (-20.9% YoY), marking the steepest decline among major sectors.
- Commercial General + Mixed Use: $8.2B (+11.3% YoY), showing resilience amid uneven sector performance.
Pricing Momentum
Pricing strengthened across most property types:
- Median price PSF rose 5% QoQ and 13.9% YoY.
- Multifamily (+18.8%), Retail (+18.5%), and Office (+15.3%) saw the sharpest annual increases.
- Subsector standouts included bars & restaurants (+42.2%), automotive (+36.6%), and storage (+27.3%).
- Manufacturing was the only subsector to decline in value, down 14.6% YoY.
Market Dynamics
Most major coastal metros beat the national average for transaction activity, with Miami, Washington, and Philadelphia posting strong YoY price increases. In contrast, New York and San Francisco underperformed by up to 10% below the national change.
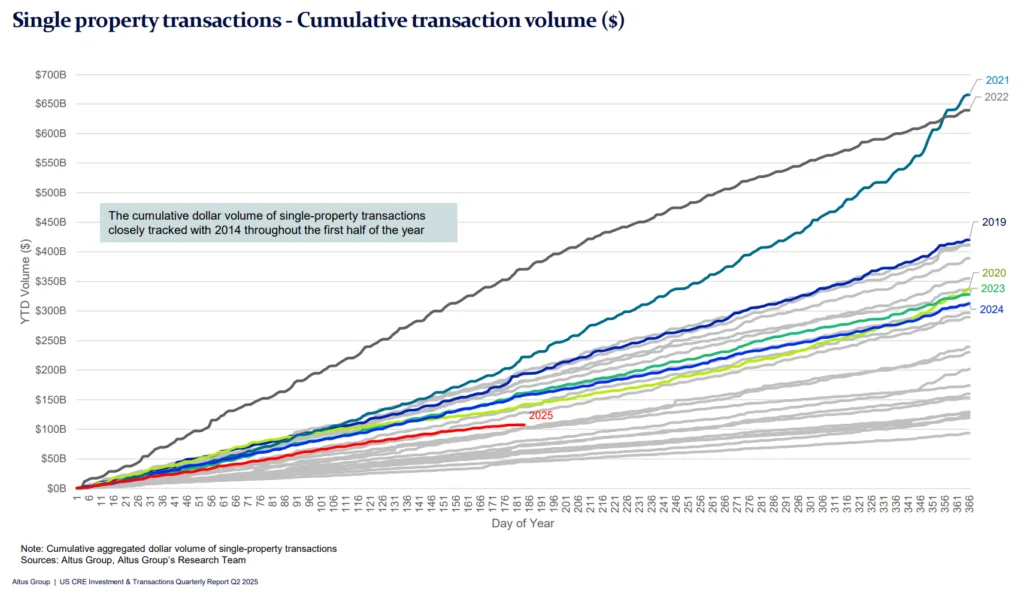
Daily deal activity picked up compared to Q1 2025 but still trails pre-pandemic 2015–2019 averages. Meanwhile, the median building size traded grew across nearly all property types, led by office (+6.8%) and commercial general (+8.9%).
Why It Matters
The Q2 data signals investor confidence returning to core sectors like multifamily and office, even as retail and hospitality continue to lag. With property prices rising at double-digit annual rates in most categories, capital is selectively chasing growth areas while avoiding risk-heavy subsectors.
Get Smarter about what matters in CRE
Stay ahead of trends in commercial real estate with CRE Daily – the free newsletter delivering everything you need to start your day in just 5-minutes