


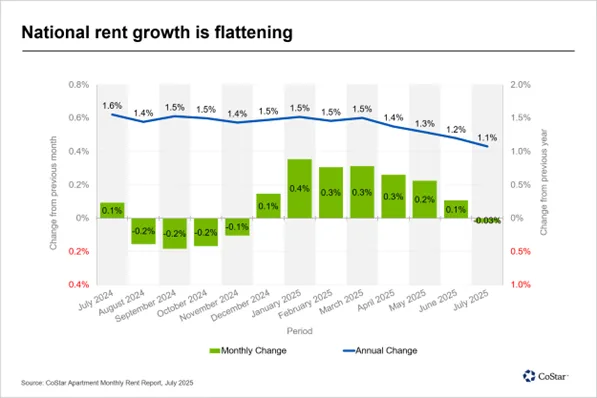
- US national average rent stayed at $1,717 in July 2025, with month-over-month growth at -0.03% — the sixth consecutive month of flat or negative change.
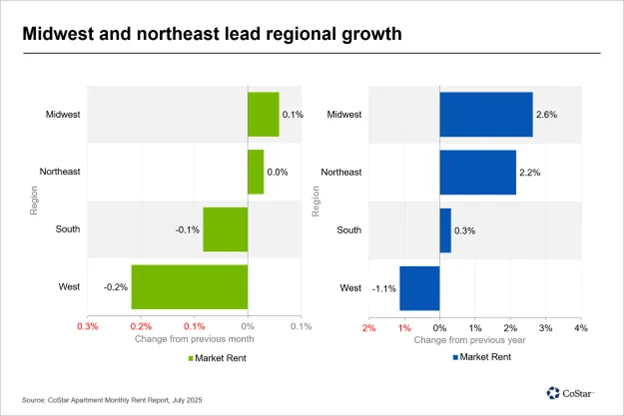
- Midwest and Northeast regions continue to post steady gains, while the South and West lag due to high new supply and weaker demand.
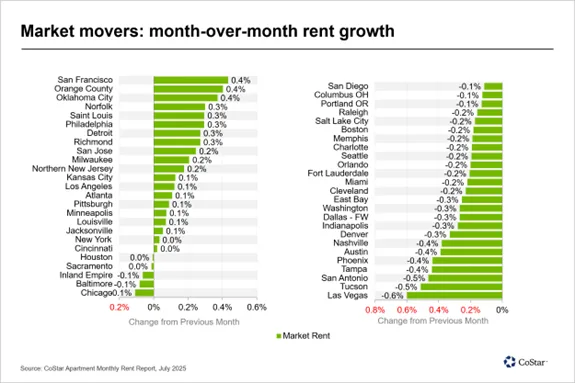
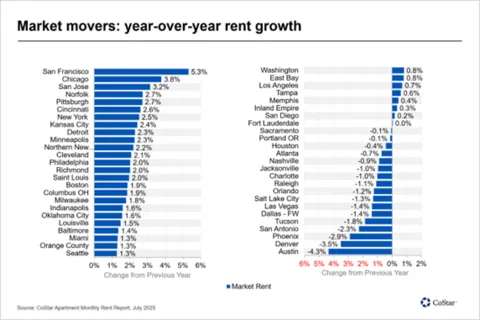
- San Francisco led national rent growth at +0.43% month-over-month and +5.3% year-over-year, while Austin saw the steepest annual drop at -4.3%.
The July 2025 Multifamily Rent Growth Report shows US rent growth has essentially stalled, reports Apartments.com. The national average rent held steady at $1,717 from June, while annual growth slowed to 1.1%, down from 1.5% at the start of the year. It marks the sixth straight month of flat or negative monthly change.
A Cooling Trend
The slowdown hasn’t tipped into a broad decline, but the trajectory since January remains downward. Supply pressures — particularly in fast-growing sun belt markets — and softer demand are tempering growth. Despite the moderation, rents remain slightly above last year’s levels.
Get Smarter about what matters in CRE
Stay ahead of trends in commercial real estate with CRE Daily – the free newsletter delivering everything you need to start your day in just 5-minutes
Regional Breakdown
Performance is split across regions. The Midwest led in July with a 0.06% monthly gain and 2.6% annual growth, followed by the Northeast at +0.03% month-over-month and +2.2% year-over-year. The South dipped -0.08% for the month but remains up 0.3% annually. The West posted the weakest showing, falling -0.22% month-over-month and -1.1% annually, as new construction continues to outpace demand.
Market Highlights
San Francisco was July’s biggest mover, posting a +0.43% monthly increase. It also recorded the highest annual gain in the nation at +5.3%. Chicago followed with +3.8% year-over-year growth, while San Jose saw a +3.2% increase. Norfolk and Pittsburgh both registered gains of +2.7%. On the downside, Las Vegas saw the steepest monthly drop at -0.60%, while Austin posted the largest yearly decline at -4.3%.
Why It Matters
The data underscores a widening divide between regions with limited new supply and those facing a construction glut. Markets with the weakest rent change are often those with the highest vacancy rates and robust development pipelines.
What’s Next
August’s numbers will be a key indicator of whether the market is stabilizing or continuing to soften, especially in coastal cities and Sun Belt metros under supply pressure. With seasonal demand set to fade in the fall, the outlook for Q4 remains cautious.