


- Between 2013 and 2023, US renter growth was concentrated at both ends of the income spectrum. The largest gains came from households earning more than 140% of National Median Income (NMI) and those earning between 60%–80% of NMI.
- The share of the lowest-income renters (<60% of NMI) declined. This was not due to falling demand but rather a shortage of affordable housing that limited household formation.
- Metro-level data shows wide variation in income trends. Some cities saw a surge in affluent renters, while others saw increases in low-income households. This underscores the need for localized investment strategies.
According to AEW, over the last decade, the US rental market has changed significantly. New analysis from the Pension Real Estate Association (PREA) shows that renter growth since 2013 has been uneven. The fastest growth came from high-income and moderate-low-income households. The lowest-income and middle-income brackets lost share. This renter bifurcation is reshaping demand for multifamily properties and creating new challenges for workforce and affordable housing.
A Market Pulling Apart
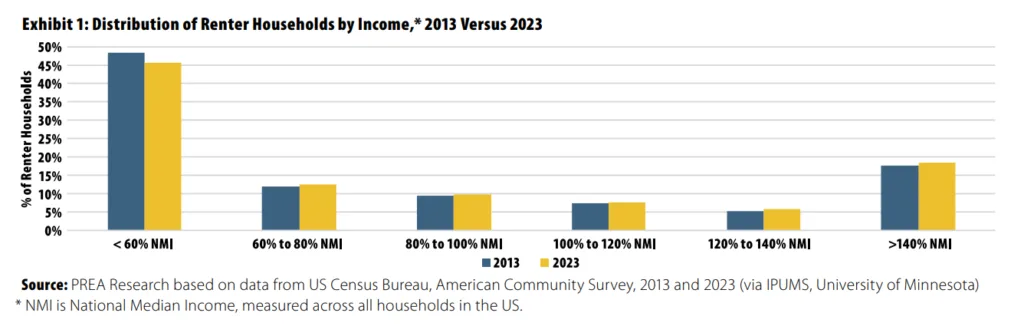
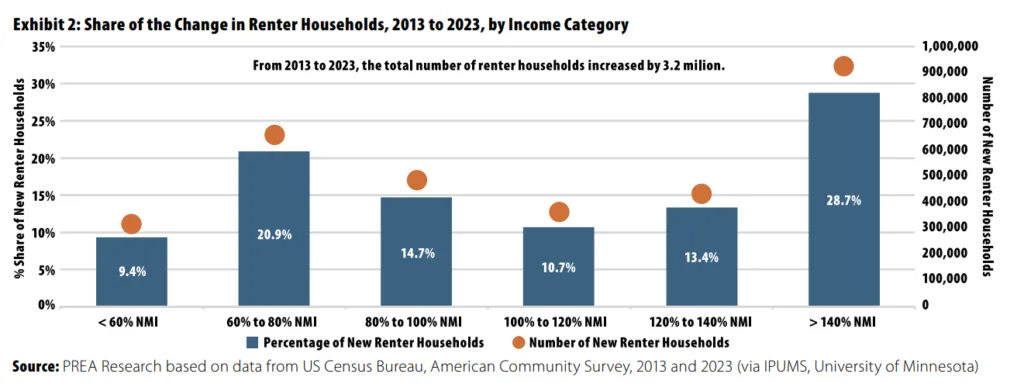
In 2023, two-thirds of US renter households (67.9%) earned less than the NMI of $76,170. Nearly half (45.6%) earned below 60% of NMI, confirming the weight of the lower-income segment. Yet, the fastest growth since 2013 came from the opposite end. Renters earning more than 140% of NMI grew by more than 919,000 households. This group accounted for almost 29% of all new renters over the decade.
Renters earning between 60%–80% of NMI saw the second-largest gain. They added 668,000 households. Together, these two groups created a “smile-shaped” pattern in income distribution — a clear case of renter bifurcation, with expansion at the top and bottom, and slower growth in the middle.
Why The Lowest-Income Share Is Shrinking
The proportion of renters below 60% of NMI fell, even though this group grew by 300,000 households. The decline in share was due to limited affordable housing. Many low-income renters stayed with family, shared units with roommates, or delayed forming households. This shortage has prevented the group from growing at the same pace as the overall renter population.
Metro-Level Variations
While the national trend is clear, local patterns differ:
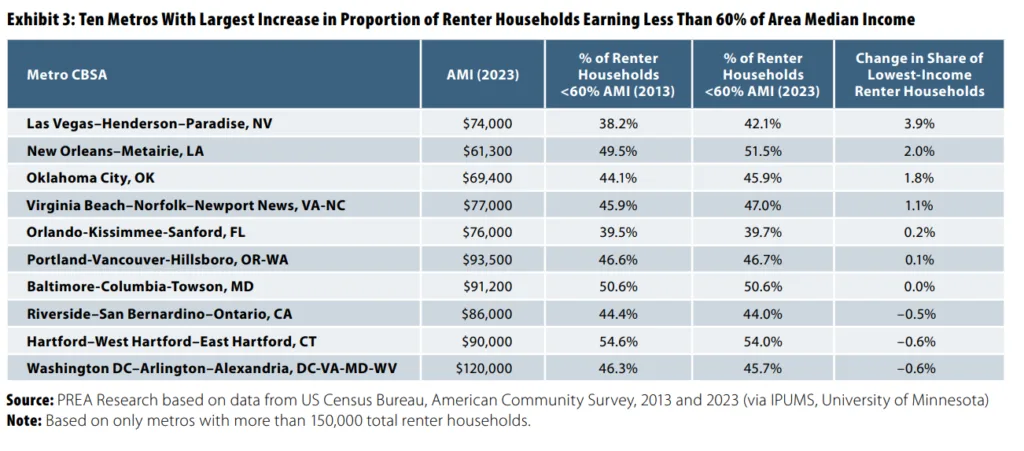
- Low-Income Growth Leaders: Las Vegas (+3.9%), New Orleans (+2.0%), and Oklahoma City (+1.8%) grew their share of renters earning less than 60% of Area Median Income (AMI).
- High-Income Growth Leaders: San Francisco (+3.8%), Denver (+3.7%), and Buffalo (+3.1%) saw the biggest gains in renters earning more than 140% of AMI. These include both expensive coastal markets and midwestern surprises.
Only 6 of the 50 largest US metros saw an increase in their low-income renter share. This highlights the affordability gap facing most major cities.
Why It Matters
For multifamily investors, this income split has direct strategic implications:
- High-End Product continues to see strong demand in many metros, especially high-growth and high-cost cities.
- Affordable Housing remains in short supply, limiting occupancy growth despite strong demand.
- Workforce Housing (80%–120% of AMI) risks losing share to other segments.
What’s Next
The divide between affluent “renters by choice” and cost-burdened low-income renters is likely to persist. However, each metro will experience it differently. Local economies, migration patterns, and housing policies will shape where opportunities and risks emerge. Successful multifamily strategies will target markets based on their unique renter income dynamics, not just the national averages.
Get Smarter about what matters in CRE
Stay ahead of trends in commercial real estate with CRE Daily – the free newsletter delivering everything you need to start your day in just 5-minutes