


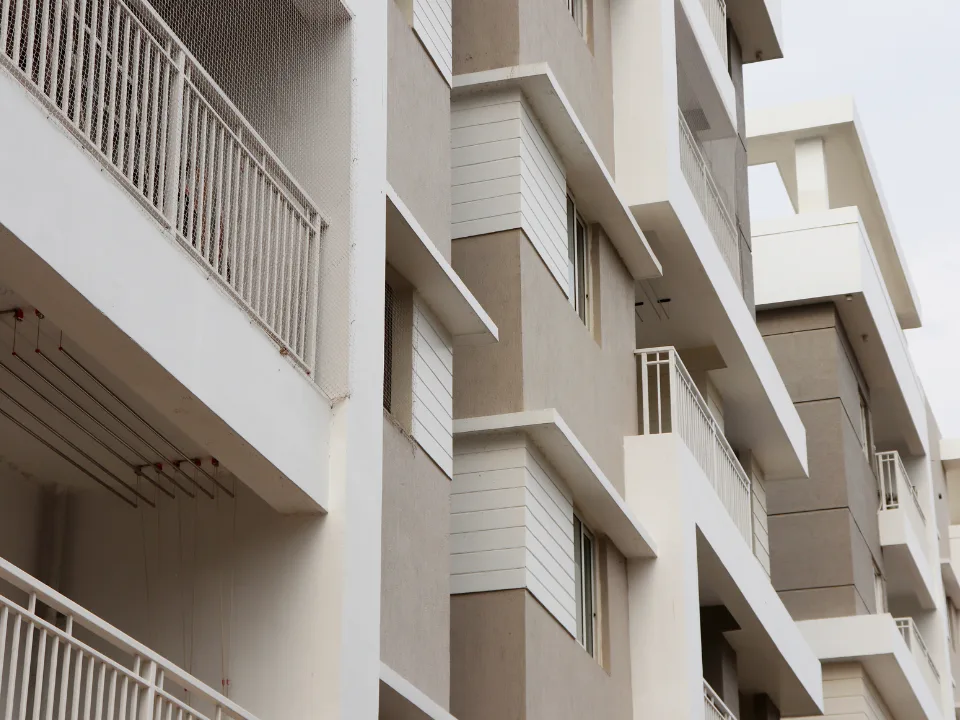
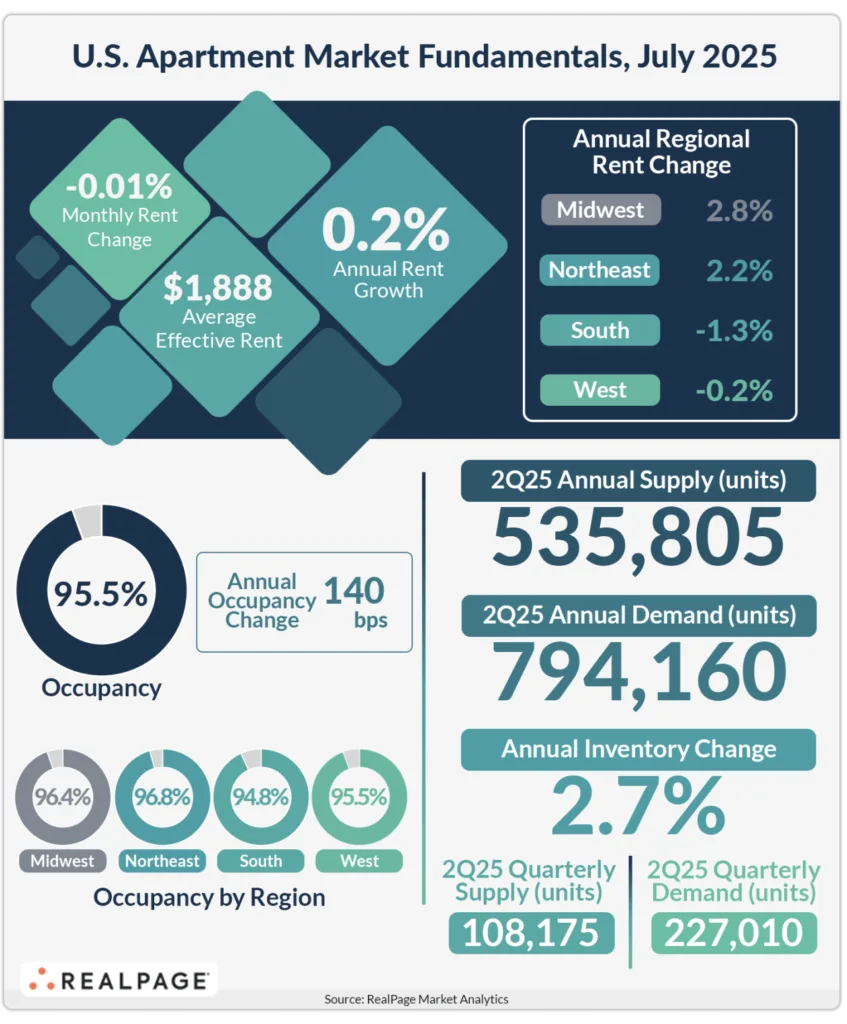
- National occupancy held firm at 95.5% in July, just off peak levels earlier this year and above the five-year average.
- Annual rent growth slowed to 0.2%, the lowest in 10 months, signaling that operators are prioritizing occupancy over pricing power.
- Absorption hit record highs, with over 794,000 units leased in the year ending Q2, despite historic levels of new supply.
- Construction and permitting activity continue to decline, setting the stage for firmer fundamentals ahead.
Summer Holding Pattern: Occupancy Strong, But Rent Growth Softens
US apartment fundamentals remained remarkably stable in July. Occupancy held at 95.5% for a second consecutive month, according to RealPage Market Analytics, and continues to trend above the five-year average of 95.4%. Year-over-year, national occupancy has climbed 140 basis points, helping to support modest rent growth even amid broader economic uncertainty.
But while occupancy remains healthy, rent growth has noticeably slowed. Effective asking rents in July were up just 0.2% year-over-year—marking the smallest annual increase in 10 months. This underscores a strategy among operators to maintain occupancy rather than test pricing power in a cooling environment.
Demand Still Outpacing Supply—For Now
Despite softer rent performance, underlying demand remains robust. The apartment sector recorded a record-breaking 794,000 units absorbed in the year-ending Q2, surpassing prior peaks in both 2021 and 2022.
Supply, although still historically high, is tapering. Roughly 535,000 new units were completed in the same period, down from the all-time high just two quarters ago. Ongoing construction is declining each quarter and has now fallen to a decade low. Meanwhile, multifamily permitting activity continues to weaken.
This tapering in new supply could provide a floor for both occupancy and rents as demand continues to adjust to broader economic conditions.
Regional Winners and Losers
The Northeast (96.8%) and Midwest (96.4%) continue to lead the country in occupancy, benefiting from restrained supply and steady demand. The West remains in line with national averages at 95.5%, while the South lags at 94.8%, reflecting continued pressure from elevated deliveries in Sun Belt metros.
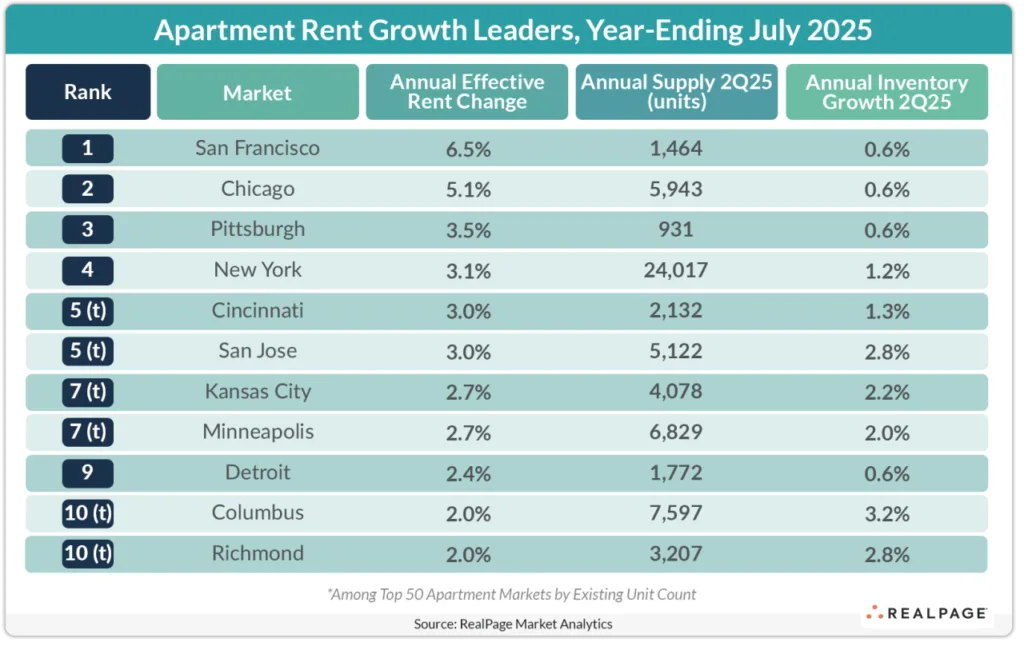
On the rent front, tech-heavy metros like San Francisco, New York, and San Jose posted gains between 3% and 7%, with Chicago, Pittsburgh, and Cincinnati also outperforming.
By contrast, tourism-dependent markets such as Orlando, Nashville, and Las Vegas posted the deepest annual rent cuts, a trend that may signal weakening discretionary spending.
Is Broader Economic Softness Seeping In
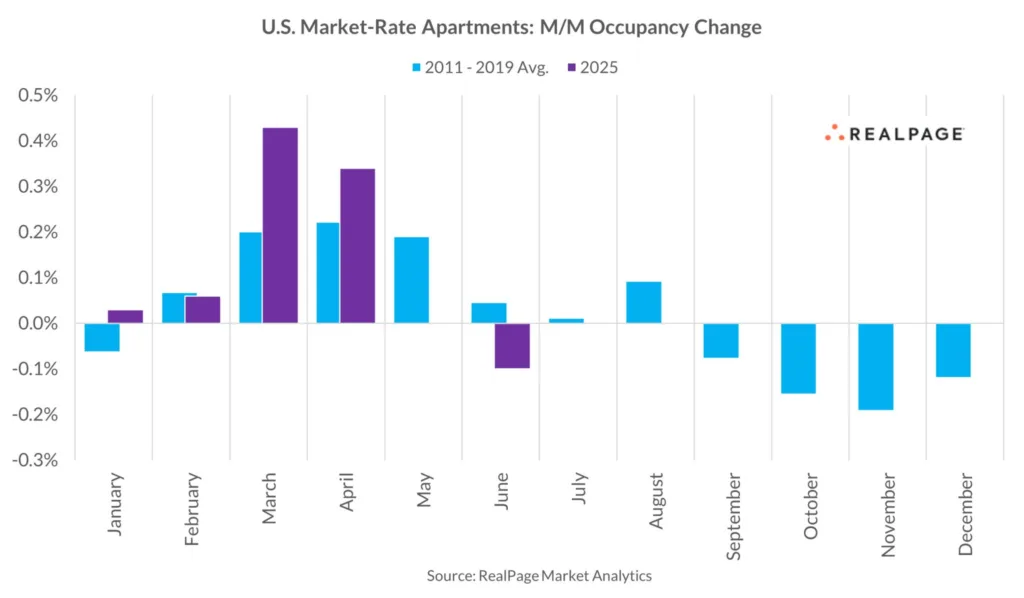
The summer leasing season typically brings momentum, but June and July 2025 failed to deliver on expectations. Analysts note that while early 2025 surprised to the upside, recent months show a flattening demand trend.
This could be a lagged reflection of wider economic signals—including slowing job growth, downward revisions to employment numbers, and higher consumer delinquencies. Particularly, labor force participation has declined, and previously strong job sectors like healthcare, education, and hospitality are showing fatigue.
These trends don’t yet amount to a downturn, but they do raise questions about renter strength heading into fall. With occupancy holding steady for now, a close watch on rent trends in the coming months will reveal whether the market’s resilience can outlast mounting macro pressures.
What’s Next
With construction pulling back and absorption still historically high, fundamentals look stable for now. But with economic cracks appearing in tourism and employment, the back half of 2025 may test just how resilient the US apartment market really is.
Get Smarter about what matters in CRE
Stay ahead of trends in commercial real estate with CRE Daily – the free newsletter delivering everything you need to start your day in just 5-minutes