


- The US industrial vacancy rate rose to 7.3% in Q2 2025 — the highest since 2013 — due to a combination of move-outs and new supply.
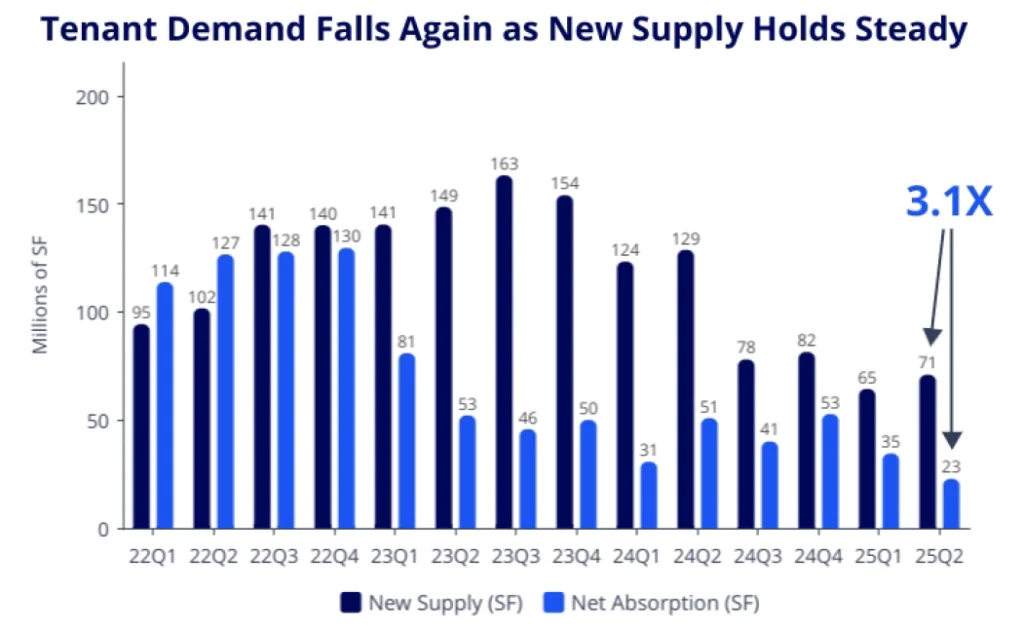
- Net absorption fell to 23 MSF, trailing 71 MSF of new supply, marking the fifth consecutive quarter of demand lagging behind completions.
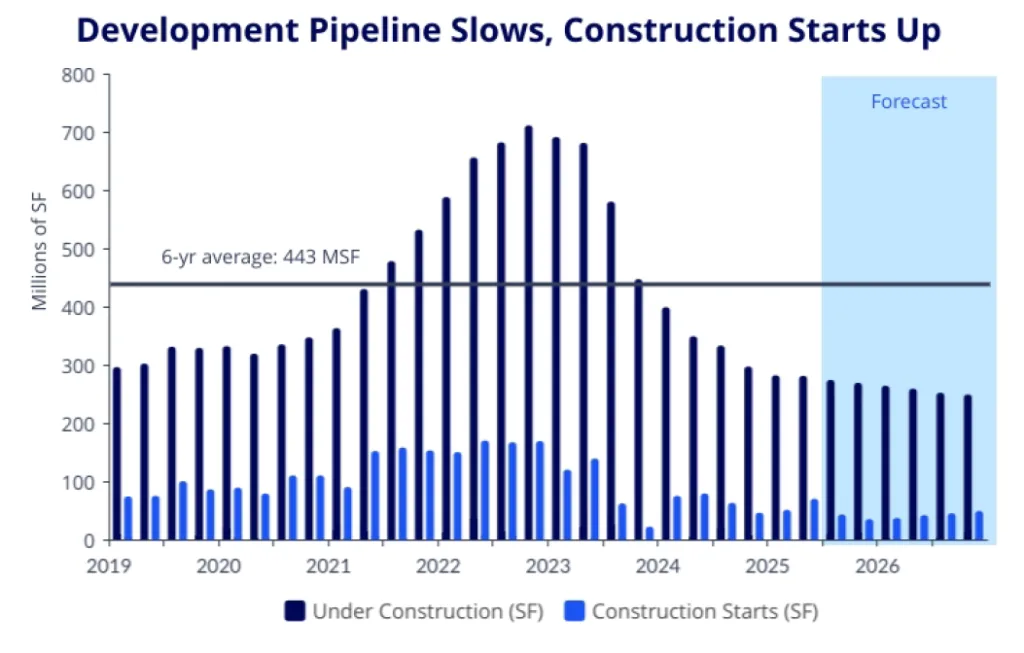
- Construction is down 60% from peak, with 281 MSF under construction, as developers recalibrate pipelines to align with market demand.
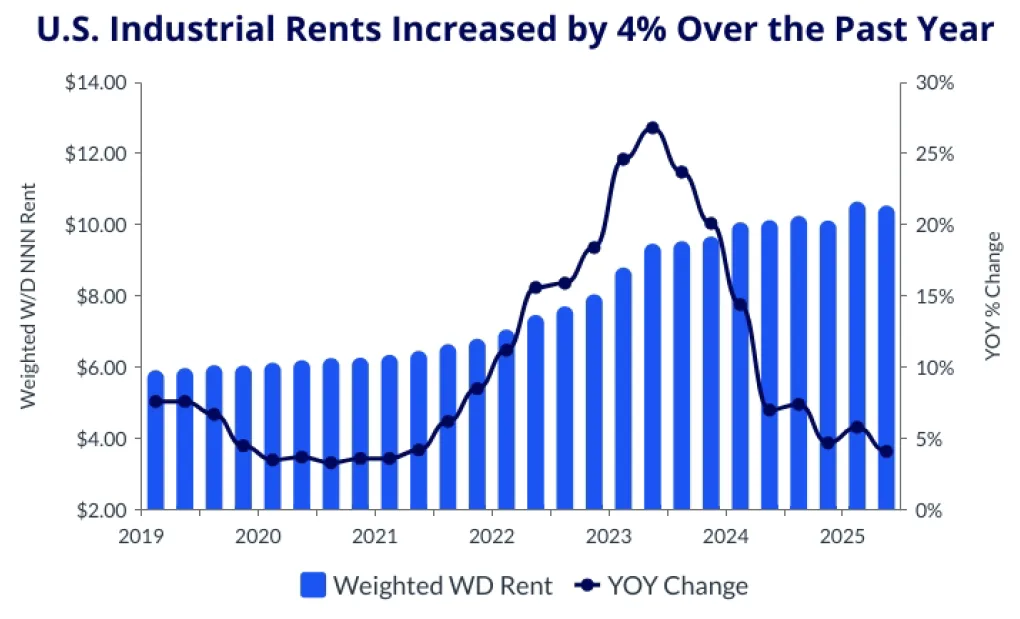
- Industrial lease rates still rose 4% YOY to $10.54/SF, though rent growth has moderated since the 2022 peak.
Vacancy Rises Despite Demand Stability
The national industrial vacancy rate climbed for the 12th consecutive quarter, reports Colliers. It reached 7.3% in Q2 2025, up 89 basis points year over year. This marks the highest vacancy level in over a decade. The imbalance stems from steady tenant move-outs and continued new deliveries.
Regional Breakdown:
- Midwest: Lowest vacancy at 5.4% (+11 bps YOY)
- South: Highest rate at 8.6%, though only a 91 bps increase
- Northeast: Largest jump, +160 bps YOY to 7.8%
- West: Up 132 bps YOY to 7.5%
Fundamentals are expected to stabilize by late 2025, with vacancy forecast to peak near 7.5% as construction slows and demand gradually rebounds.
Get Smarter about what matters in CRE
Stay ahead of trends in commercial real estate with CRE Daily – the free newsletter delivering everything you need to start your day in just 5-minutes
Demand Lags Behind Supply Growth
Only 23 MSF of net absorption occurred in Q2, compared to 71 MSF of new deliveries — a 3.1x gap. This marks the fifth straight quarter of excess supply over tenant demand, though preleasing and build-to-suit activity remain supportive in some markets.
Top Markets for Absorption:
- Dallas-Fort Worth: 6.4 MSF
- Chicago: 5.1 MSF
- New York City Metro: 3.6 MSF
Despite muted leasing activity, net absorption is forecast to improve over the next four quarters, closing the supply-demand gap.
Construction Activity Drops To 2018 Levels
The industrial pipeline has sharply contracted, with just 281 MSF under construction — a 60% drop from the Q4 2022 peak of 711 MSF. Starts have slowed as developers wait for vacancy stabilization and lease-up progress.
Top Markets for Construction:
- Dallas-Fort Worth: 31.7 MSF (down 41% YOY)
- Houston: 18.8 MSF (down 10% YOY)
- Los Angeles, Austin, and Phoenix round out the top five
Developers are expected to maintain a more cautious pace, with new starts hovering around the long-term average of 443 MSF annually.
Lease Rates Still Climbing, But At A Slower Pace
Average warehouse/distribution asking rents rose 4% YOY to $10.54/SF — a deceleration from the double-digit rent hikes seen in 2021–2022.
Highest Rents by Market:
- New York City Metro: $16.77/SF (+1% YOY)
- Los Angeles: $15.26/SF (+1% YOY)
- San Francisco Bay Area: $14.85/SF (-3% YOY)
Rents are expected to remain stable as new deliveries slow, though markets like Atlanta (+12% YOY) and Dallas-Fort Worth (+7% YOY) continue to see elevated growth.
Why It Matters
Rising vacancy and slowing demand are resetting expectations in the US industrial sector. However, with construction tapering and rent growth holding steady, market fundamentals are showing early signs of stabilization. The coming quarters will be key in determining how quickly absorption can catch up to new supply.
What’s Next
Expect continued normalization through late 2025 as vacancy peaks and developers become more selective. The long-term outlook remains favorable, especially in high-demand logistics markets with infrastructure advantages.