- Office vacancy hit 19.4% in June, with job growth in office-using sectors nearly flat year-over-year.
- $290B in office loans mature by 2027, with delinquencies rising and fewer extensions available.
- Construction has slowed to historic lows, with only 41M SF underway nationwide.
- Office-to-residential conversions are gaining momentum as landlords seek alternative uses.
A Sector Under Pressure
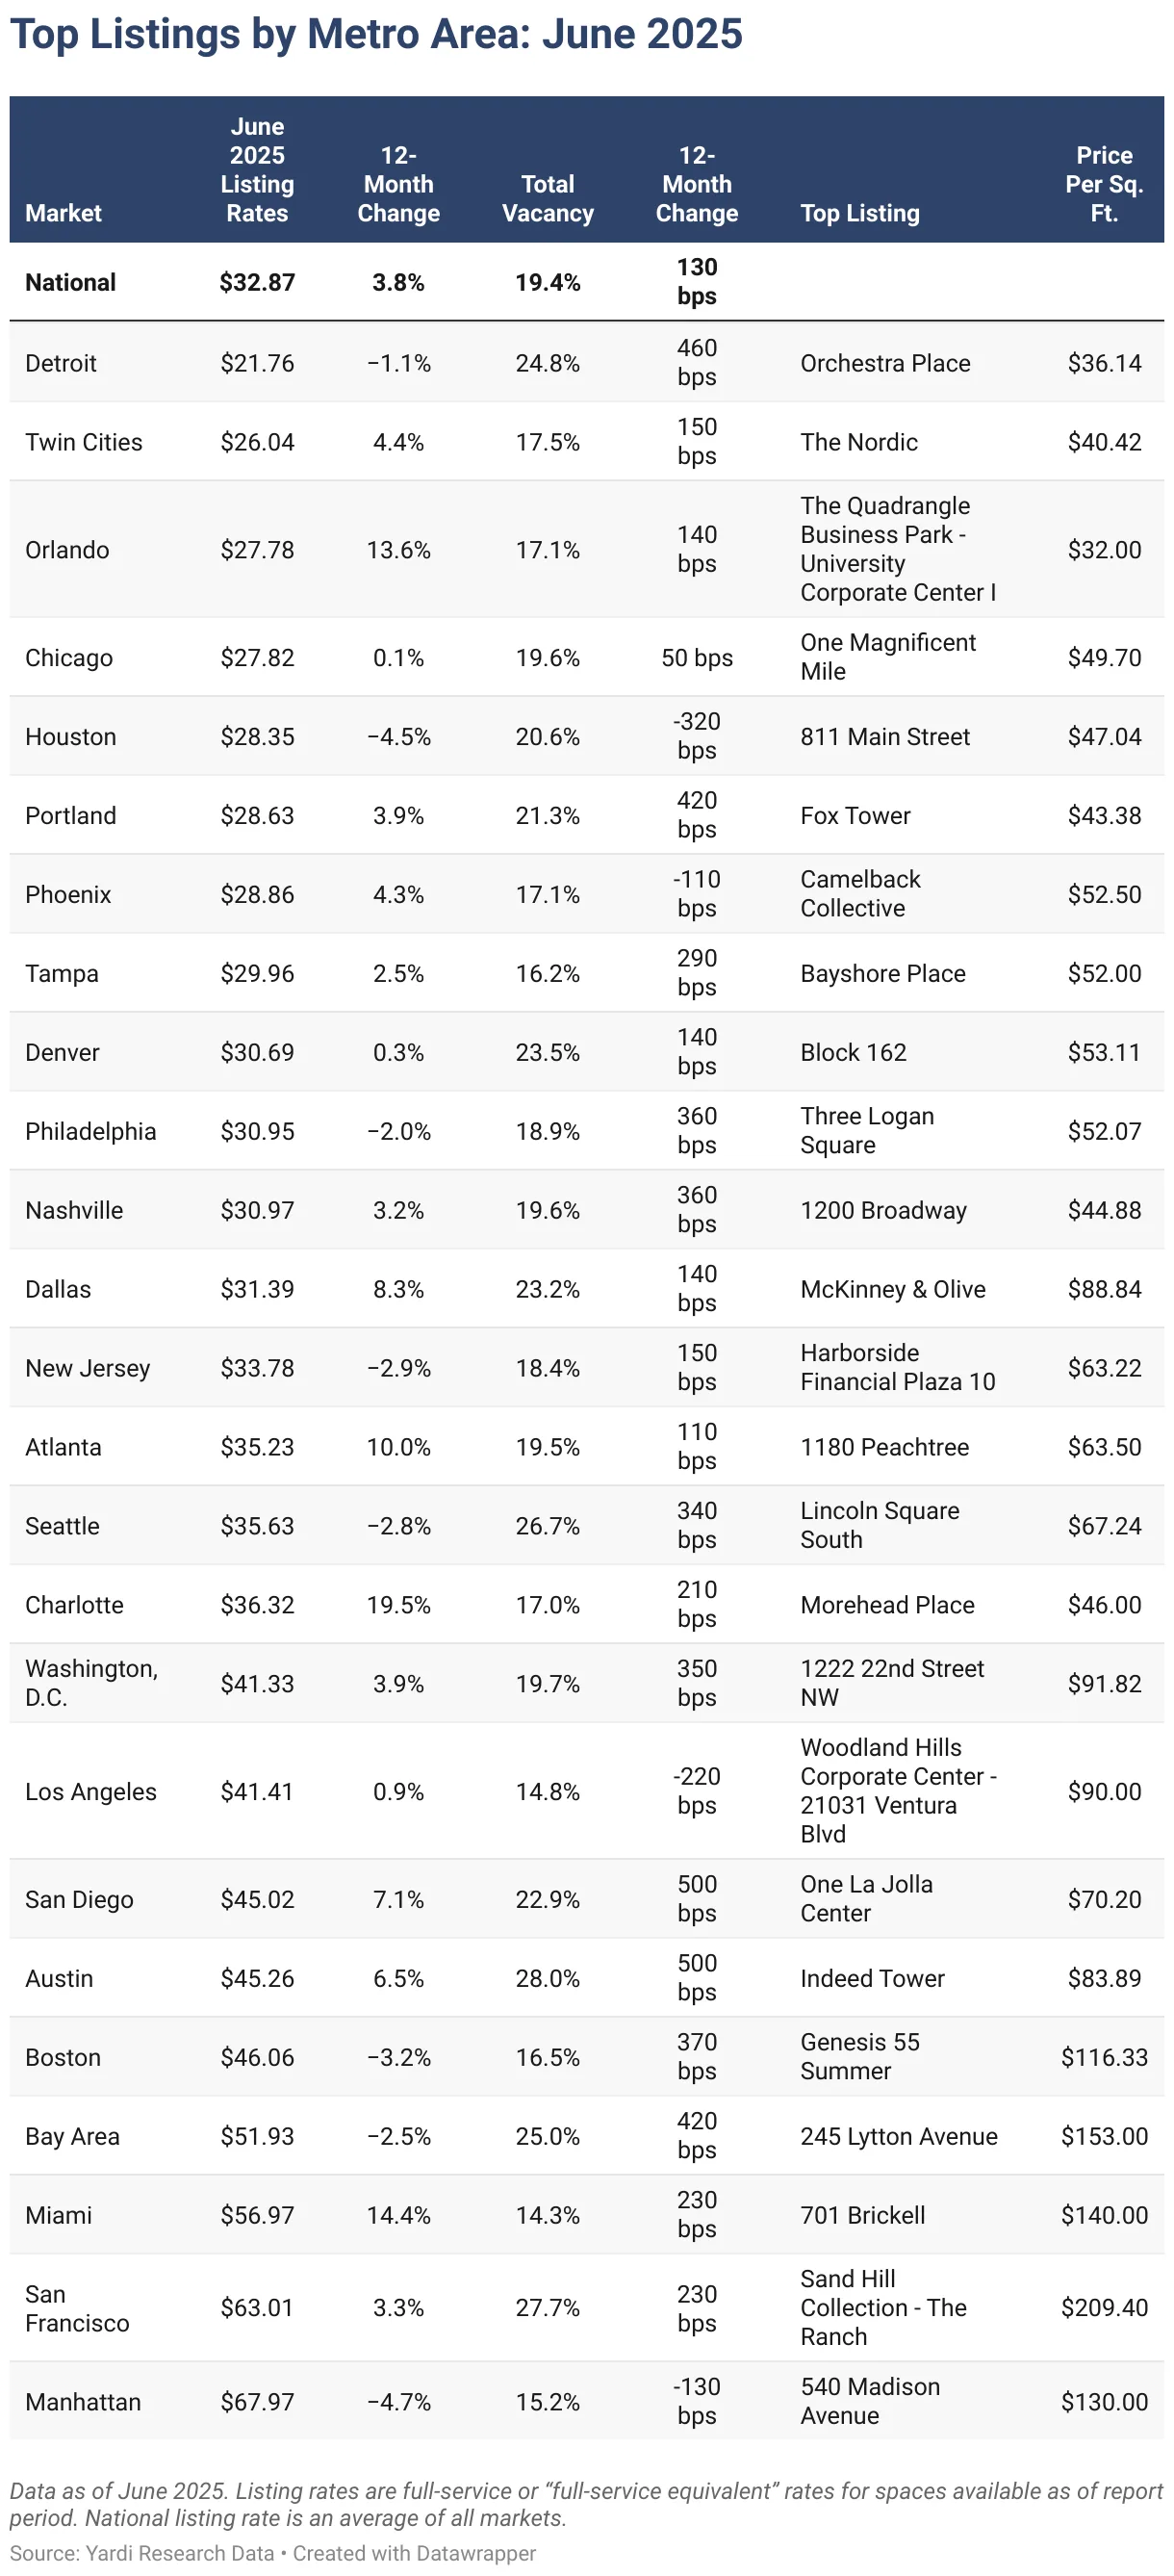
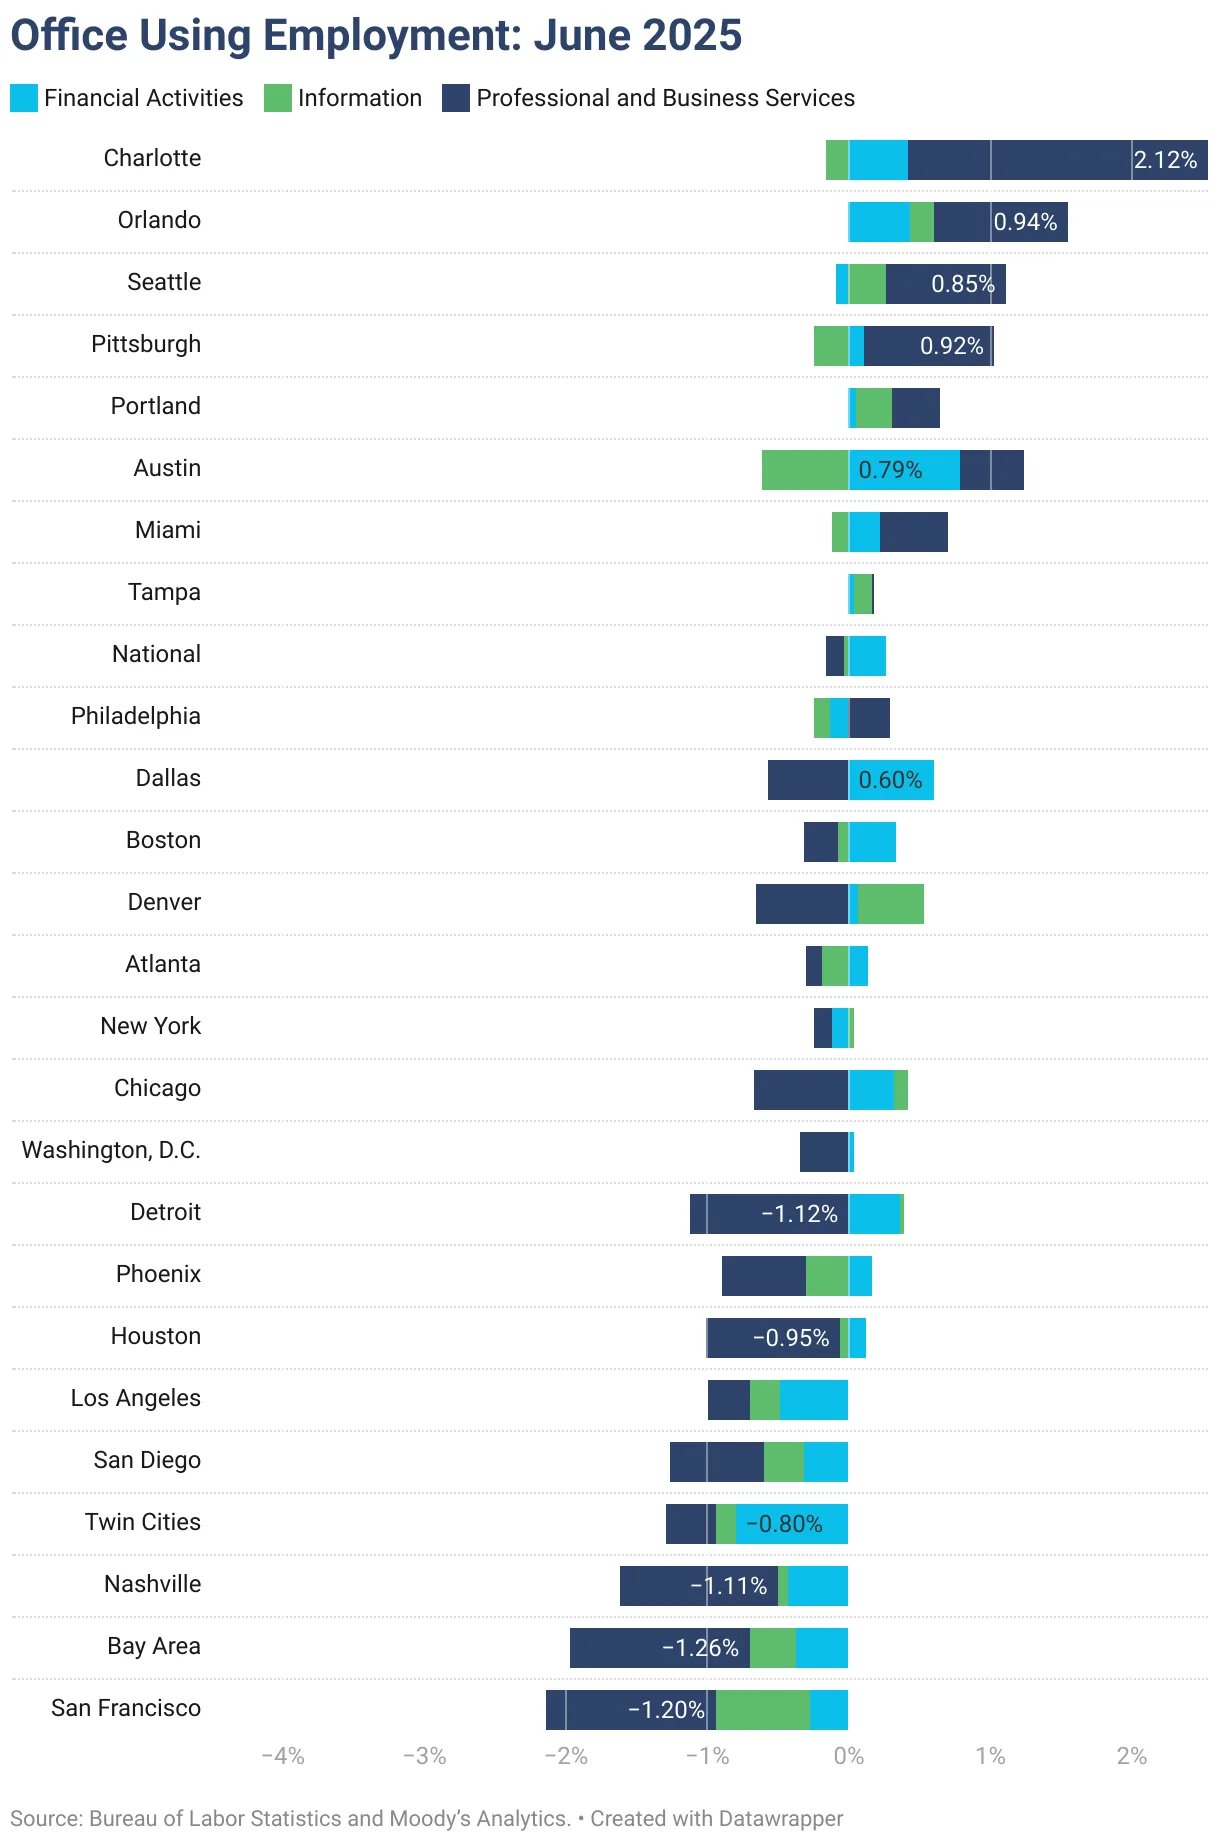
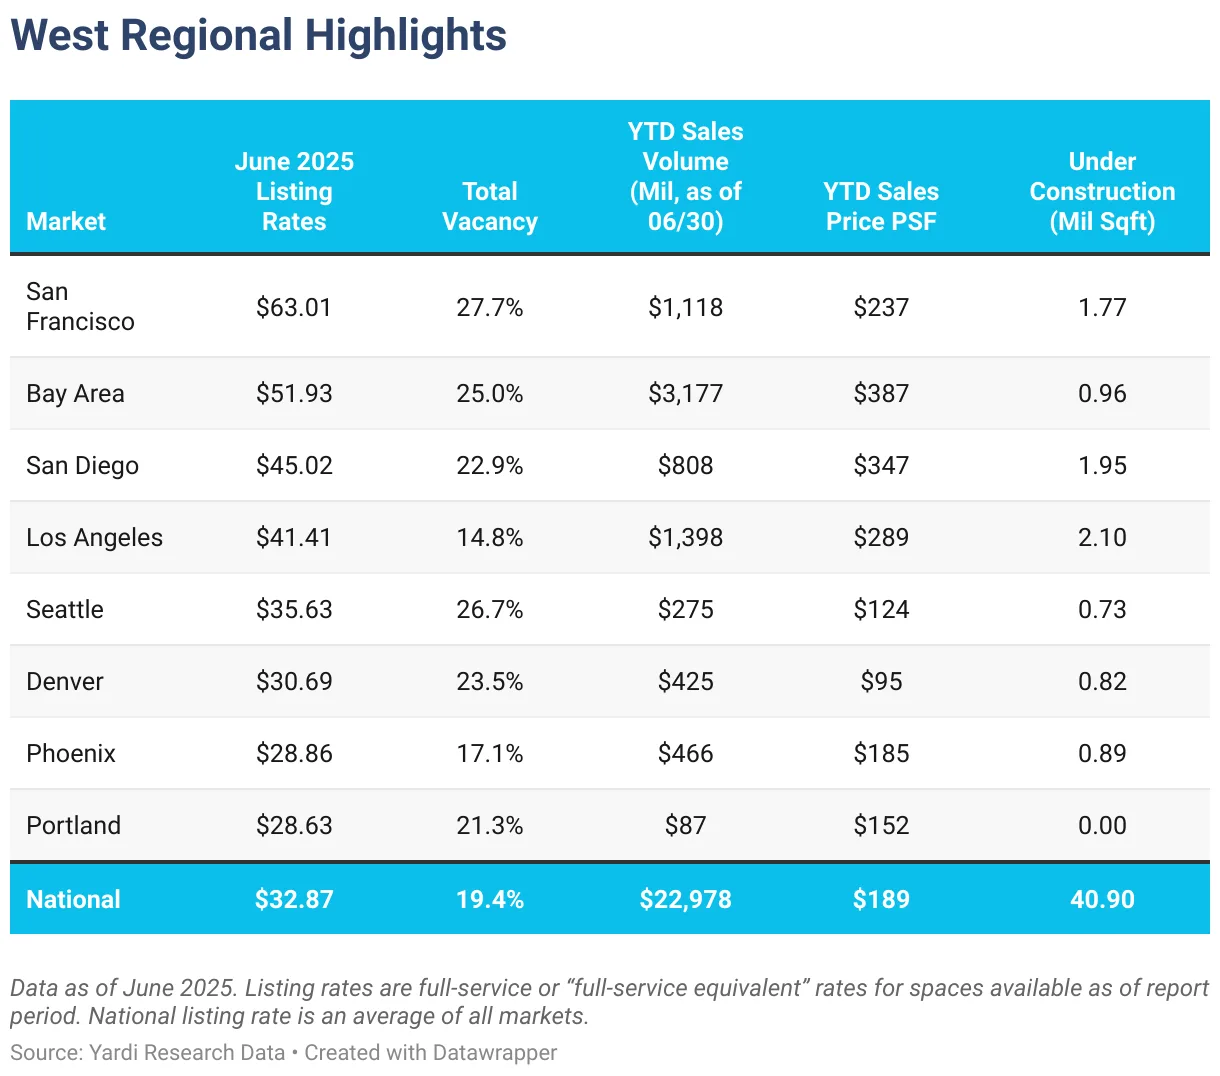
The US office sector is facing sustained headwinds, reports Commercial Cafe. Reports state national vacancy rates stuck at 19.4% in June—up 130 basis points year-over-year. Office-using employment has grown just 0.1% over the last 12 months, stalling demand recovery in most markets. At the same time, listing rates have inched upward to an average of $32.87 PSF, a 3.8% annual increase, despite weak fundamentals.
Loan Maturities Raise The Stakes
One of the most pressing issues: a looming wall of debt. Yardi Research estimates nearly 14K office properties—representing $290B in loans—have maturities either recently passed or due by 2027. That’s one-third of the market. Trepp data shows delinquency on office CMBS surged to 11.08% in June, signaling mounting distress.
Loan extensions, a lifeline for borrowers in recent years, are becoming harder to secure. Many lenders are now reluctant to kick the can further down the road. As Peter Kolaczynski of Yardi put it, “More buildings will have their future determined in the second half of 2025 than we have seen recently.”
Widening Performance Gaps By Market
While distress is widespread, market-level performance continues to diverge:
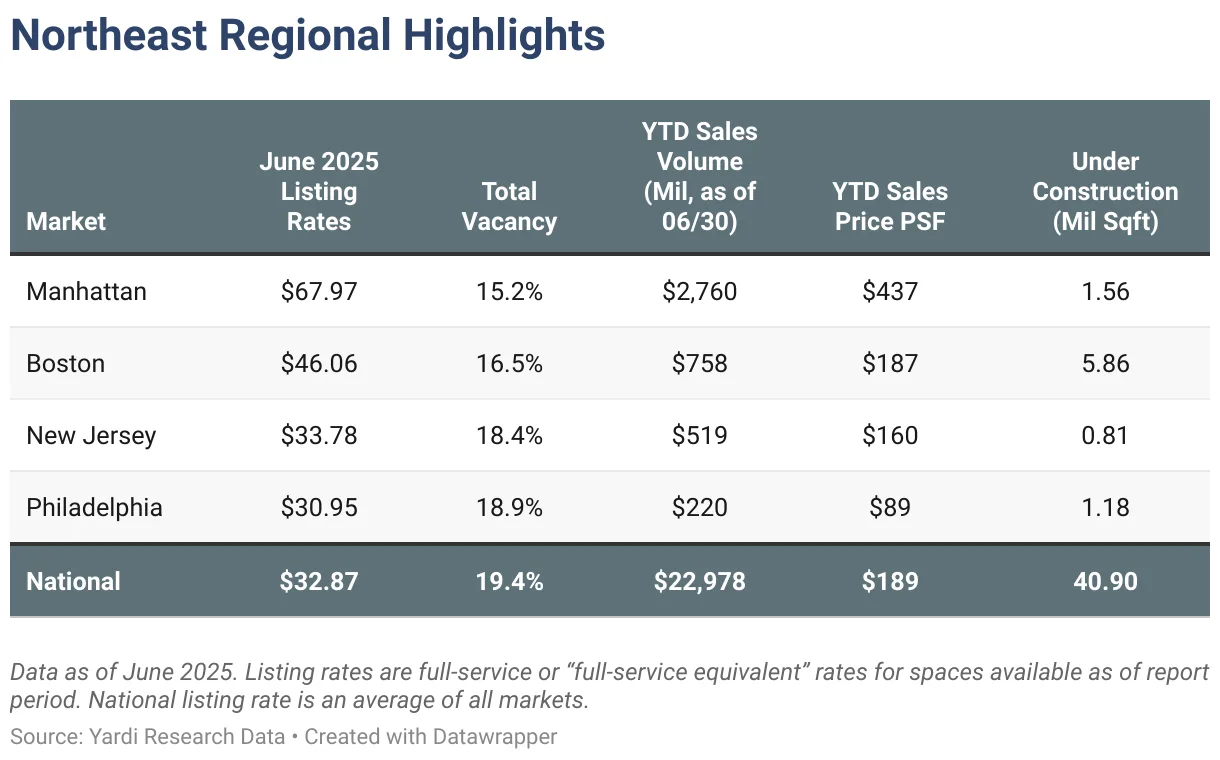
- Austin, TX holds the highest national vacancy at 28% and a large construction pipeline (2.7M SF).
- San Francisco vacancy reached 27.7%, while life sciences developments struggle with oversupply.
- Manhattan, NY remains a relative bright spot with 15.2% vacancy, supported by legal, finance, and tech tenants. Amazon alone has signed 1.5M SF of leases in the city since last fall.
- Miami leads the South in both office rents ($57 PSF) and sale prices ($255 PSF), buoyed by strong demand and tight inventory.
Investment Trends
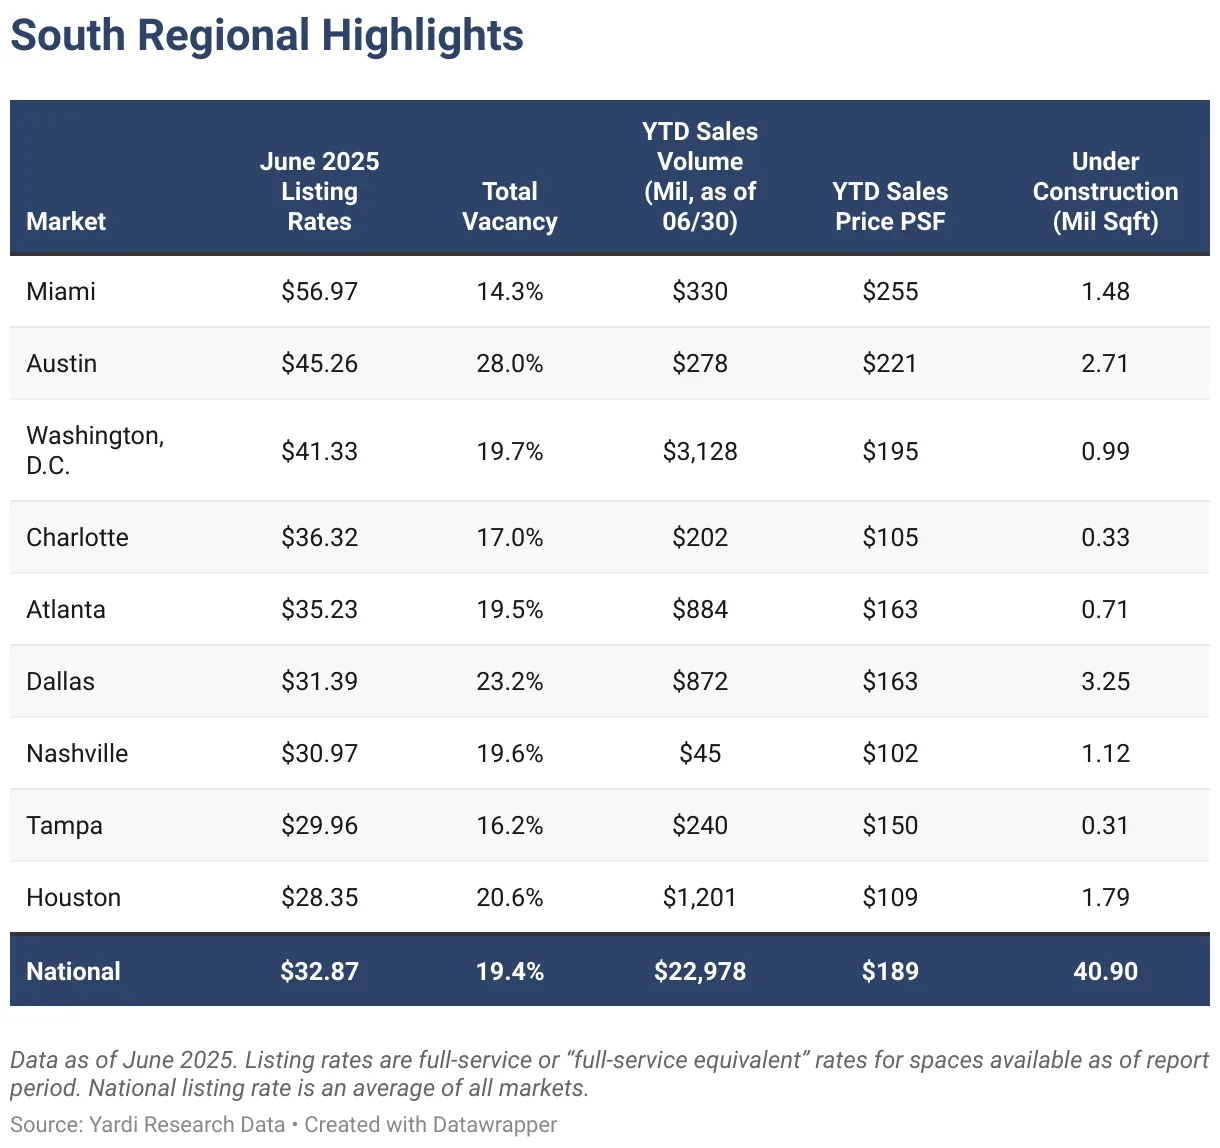
Investment activity is uneven but declining overall. Nationally, office sales hit $23B in the first half of 2025, with an average sale price of $189 PSF. Discounted deals are becoming more common, especially in markets like Atlanta, where the 1100 Peachtree tower sold at a nearly $14M loss from its 2007 price.
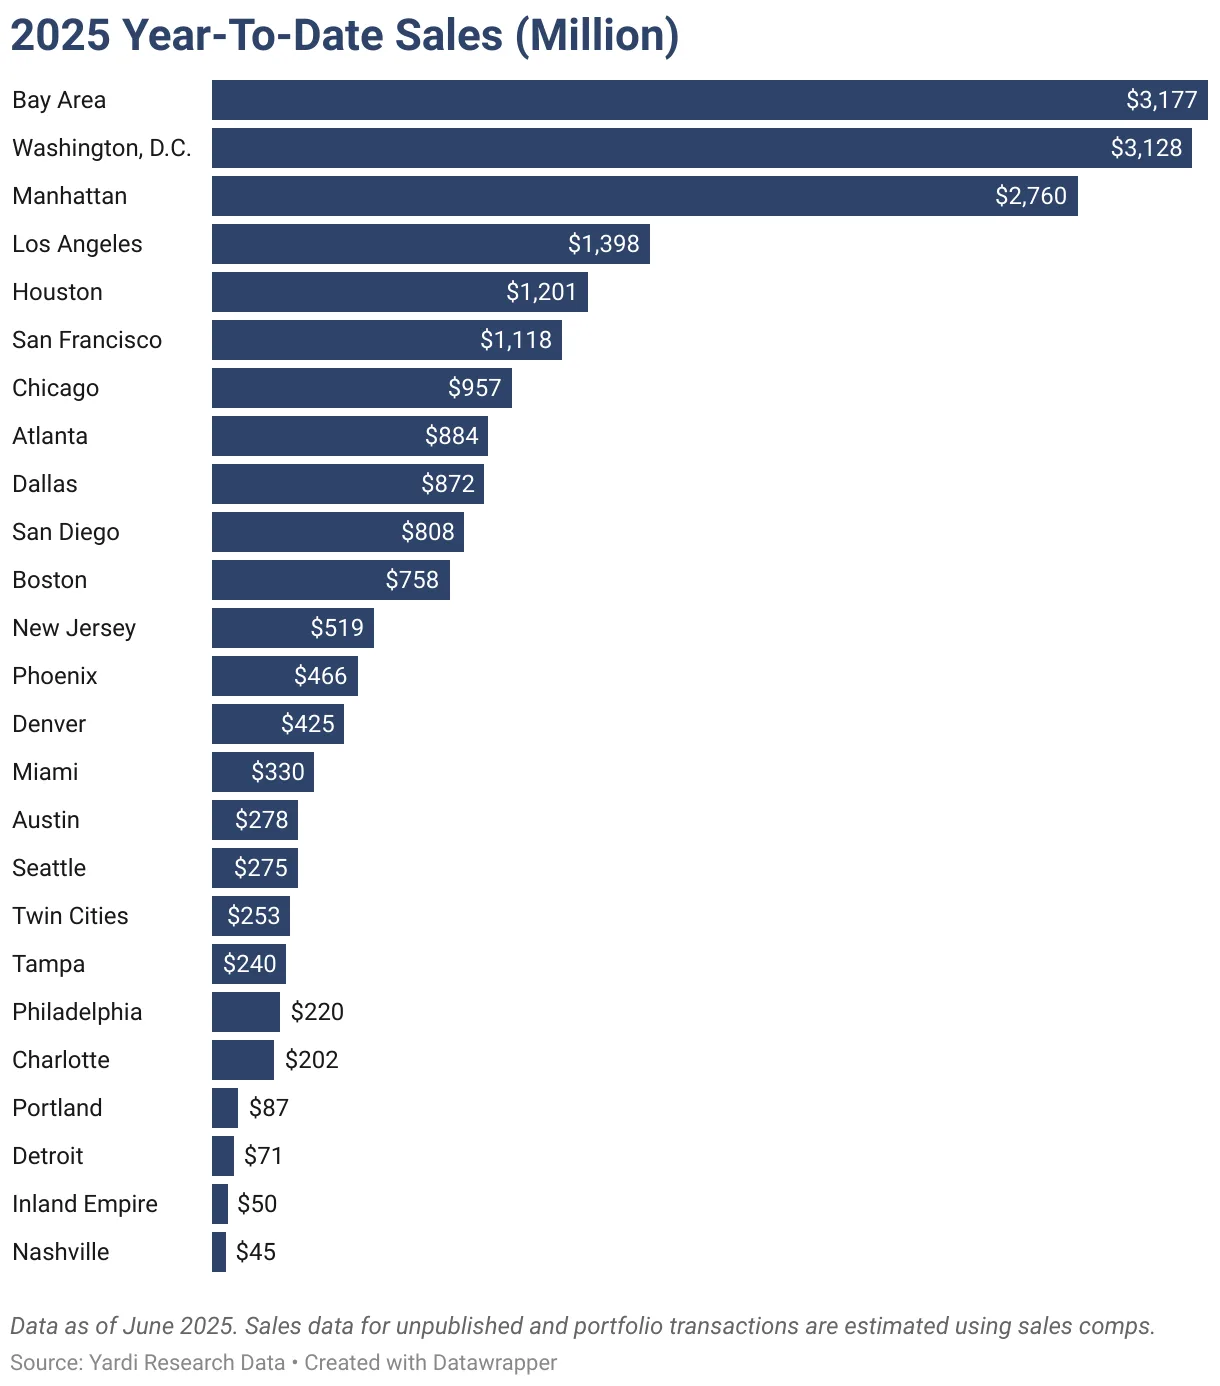
Markets like Chicago and the Twin Cities saw below-average prices—$57 and $72 PSF, respectively—but investment volumes are holding up better than expected. In contrast, Boston and the Bay Area remain among the most expensive, trading at $387 and higher PSF.
Construction Slows, Conversions Loom
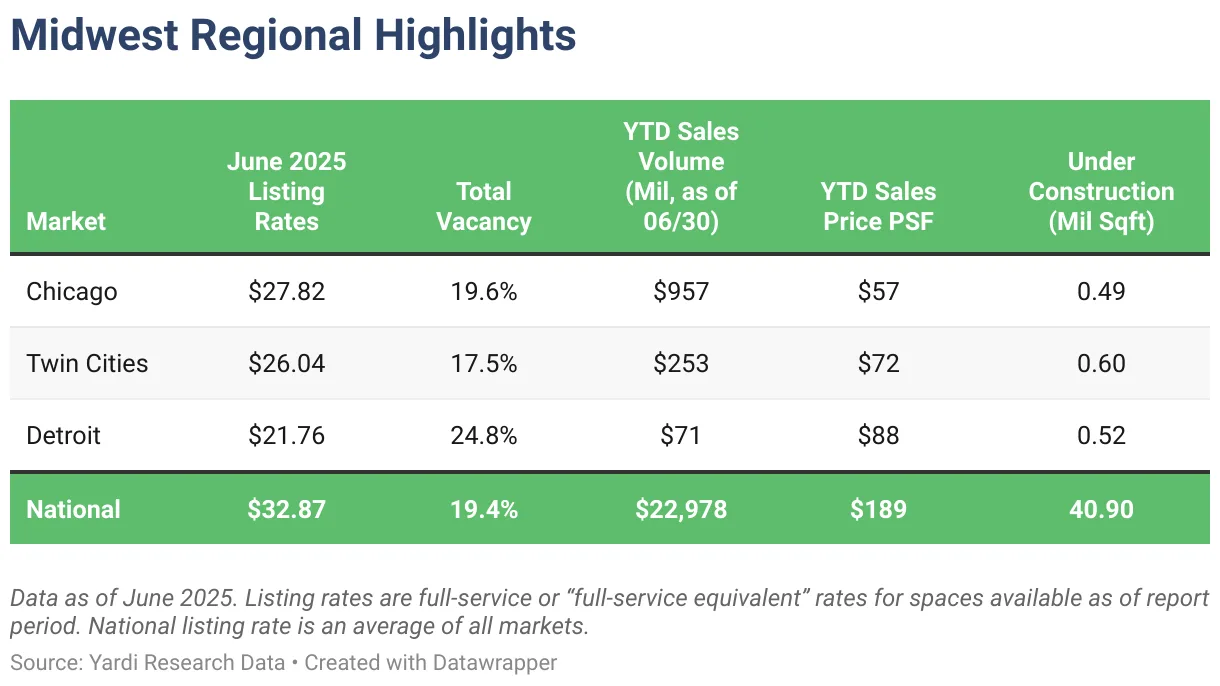
New office development is grinding to a halt. The 41M SF under construction nationwide marks a new low for the cycle, reflecting developer caution amid rising vacancies and tighter financing. Notably, Boston leads the nation with nearly 6M SF underway, followed by Dallas-Fort Worth.
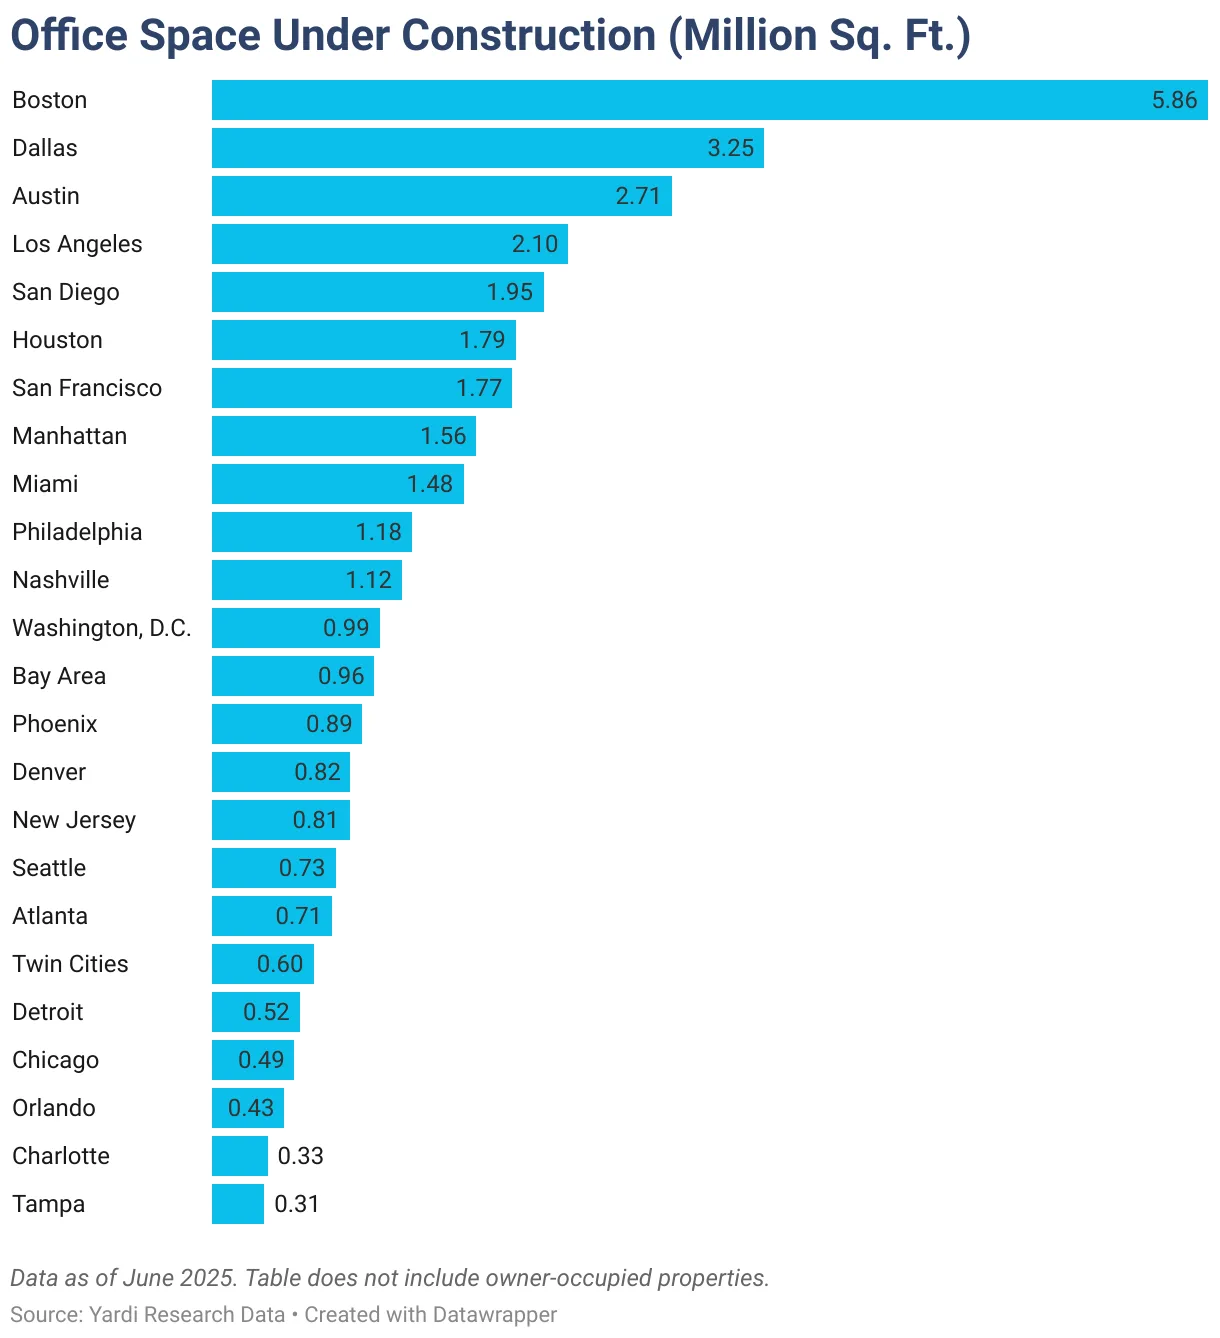
Even previously hot sectors like life sciences are showing cracks. San Diego, for example, has struggled to lease the 3.5M SF of lab space built since 2020.
Expect more adaptive reuse projects in coming years as developers and cities pivot underutilized office space to residential and mixed-use formats.
A Market In Transition
The US office sector isn’t likely to recover quickly. Structural changes in work culture, combined with persistent financial pressures, suggest more pain—and transformation—ahead.
office landlords will continue to face tough decisions as maturing debt converges with muted demand and elevated vacancies. In many cases, conversion or significant repositioning may be the only viable path forward.
The second half of 2025 may prove pivotal, as the window for refinancing narrows and distressed sales pick up across major metros.
