


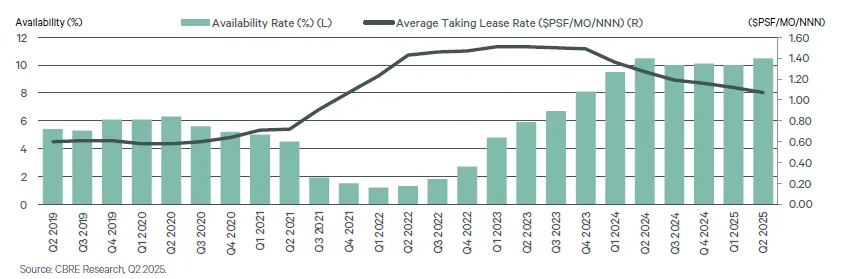
- The Inland Empire industrial market saw average lease rates drop 4.5% quarter-over-quarter to $1.07 PSF, the eighth straight quarter of declines.
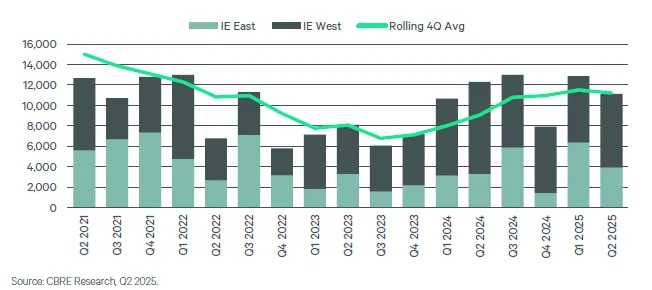
- Despite a resilient leasing market—11.1M SF in the IE Core—net absorption turned negative, driven by large move-outs in big-box properties.
- Build-to-suit projects surged, with 5.5M SF breaking ground, mostly in facilities over 500K SF, signaling occupier demand for customized, large-scale solutions.
Market In Transition
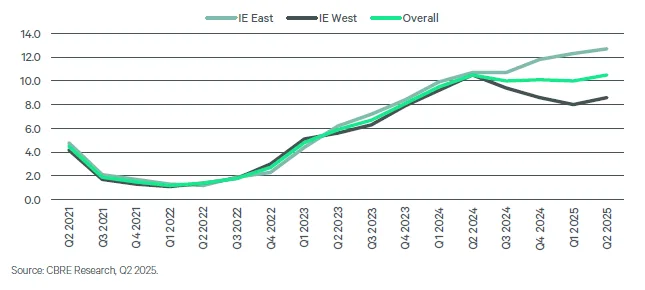
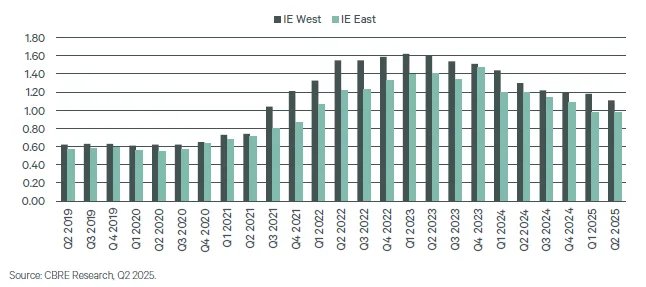
Q2 2025 was another quarter of contrasts for the Inland Empire (IE) industrial market, reports CBRE. Vacancy in the IE Core (comprising IE East and West) edged up to 6.7% from 6.6% in Q1, while lease rates fell to $1.07 PSF, down 15.7% year-over-year. The drop reflects abundant supply and greater concessions by landlords competing for tenants amid macroeconomic uncertainty.
Demand Stays Strong
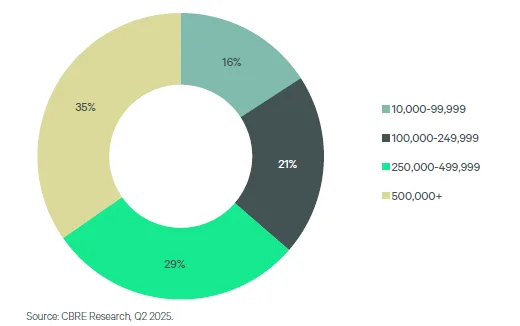
Despite the negative net absorption of 740K SF in the IE Core, leasing activity remained robust. Gross leasing volume hit 11.1M SF, with the broader Inland Empire totaling 12.1M SF Leasing was particularly strong in the 250K–499,999 SF range, while sublease activity—totaling 1.9M SF—helped occupiers capitalize on discounted space.
Construction Heats Up
Development ramped up in the Inland Empire with 5.5M SF breaking ground, 81% of which was in projects over 500K SF Notable build-to-suit deals included:
- A 2.6M SF e-commerce facility in Hesperia,
- A 1.2M SF third-party logistics project in Apple Valley,
- A 670K SF food user development in Ontario.
Despite the increase in starts, only 1.6M SF was delivered in Q2, keeping the pipeline tight for now.
Get Smarter about what matters in CRE
Stay ahead of trends in commercial real estate with CRE Daily – the free newsletter delivering everything you need to start your day in just 5-minutes
Pricing Pressures And Sublease Dynamics
The average taking lease rate dropped to $1.07 PSF—$0.05 lower than the prior quarter. Sublease rates were even lower at $0.90 PSF, creating downward pressure across the board. With subleases making up 15% of new leasing, cost-sensitive occupiers leveraged the softening market to negotiate favorable terms, including higher concessions and free rent.
Investment Market Cools
While users remained active, transacting 456K SF of space, investor purchases dropped 43% quarter-over-quarter and nearly 59% year-over-year. Uncertainty over trade policy and lease rate forecasting caused many investors to delay acquisitions.
Looking Ahead
Despite short-term headwinds from shifting trade policies and softening sentiment, the Inland Empire remains well-positioned for long-term industrial growth. Its proximity to the nation’s busiest port complex and a large labor pool make it a critical hub for logistics and retail occupiers. The recent rebound in preleasing—from 23% to 39%—suggests renewed confidence heading into the second half of 2025.
Why It Matters
The Inland Empire’s market dynamics signal a recalibration rather than a downturn. With occupiers still actively leasing and developers pressing forward on tailored facilities, the industrial sector remains resilient—even as the pricing power shifts temporarily from landlords to tenants.